Enhanced Click Tracking for Email
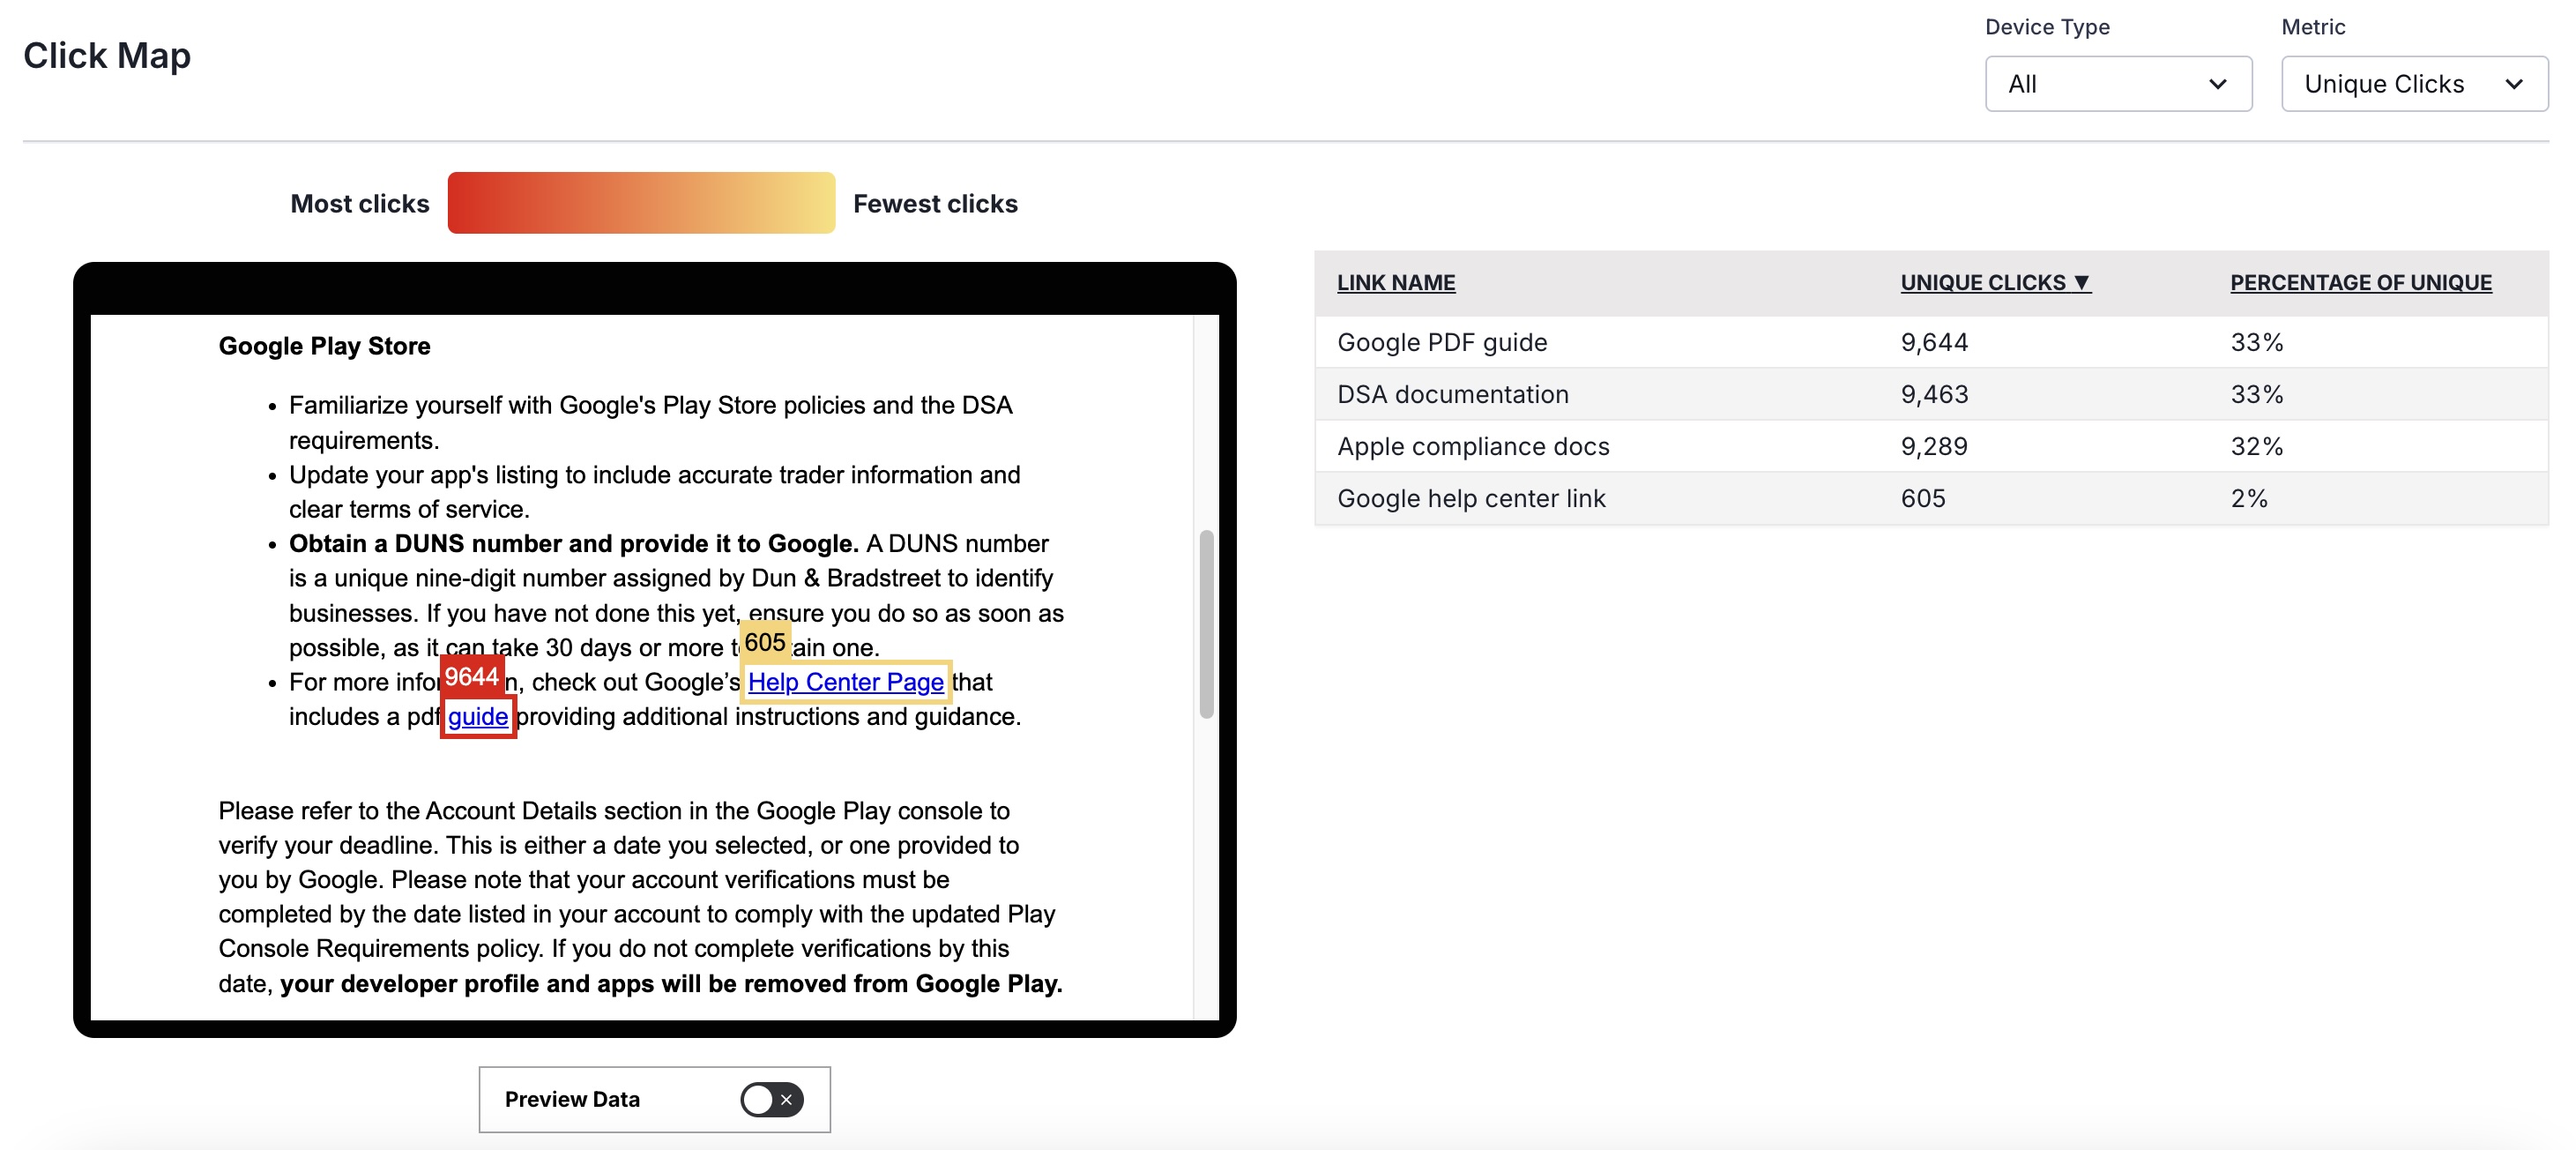
The email Click Map is a type of heat map that helps you learn how your audience interacts with your messages.
When users follow links in an email, the URLs and related metrics appear in the Performance section of a message report. Today’s release adds a Click Map to email message reports to help you learn how to optimize message layout.
By visually representing where users click most frequently, you can see which parts of an email attract the most attention and measure the effectiveness of call-to-action buttons, images, and text according to their placement. Use this information to ensure that key elements are positioned where they are most likely to be seen and engage users.
Using the Click Map
First, give custom names to the links in your message, either in the WYSIWYG editor or using the HTML attribute data-ua-linkname on anchor tags. After sending your message, you can see how the links performed.
Go to Messages, then Messages Overview, select the report icon () for the email, and see the Click Map in the Performance section:

Within a preview of the message body, any named link clicked by a user is highlighted. The volume of clicks is indicated by a highlight color in a gradient from red (most) to yellow (fewest). A table lists the same links with click counts and the percentage of clicks relative to all links in the message. You can filter the preview and table by device type and Total Clicks or Unique Clicks.
Use Preview Data to see how personalized content in your message appears when populated with user data instead of default values. This can reveal links that might appear in the table but not in the message body due to conditional logic.
Documentation
- Email performance in Message Reports
- Link names in Email content
- Previewing personalized content