 Feb 8, 2024
App Health Dashboard
App health reports give you meaningful metrics for evaluating the success of your app.
No data analyst? No problem. The App Health dashboard tells you about your users at each stage of the mobile app lifecycle and can help you gauge overall program performance.
Dashboard walkthrough
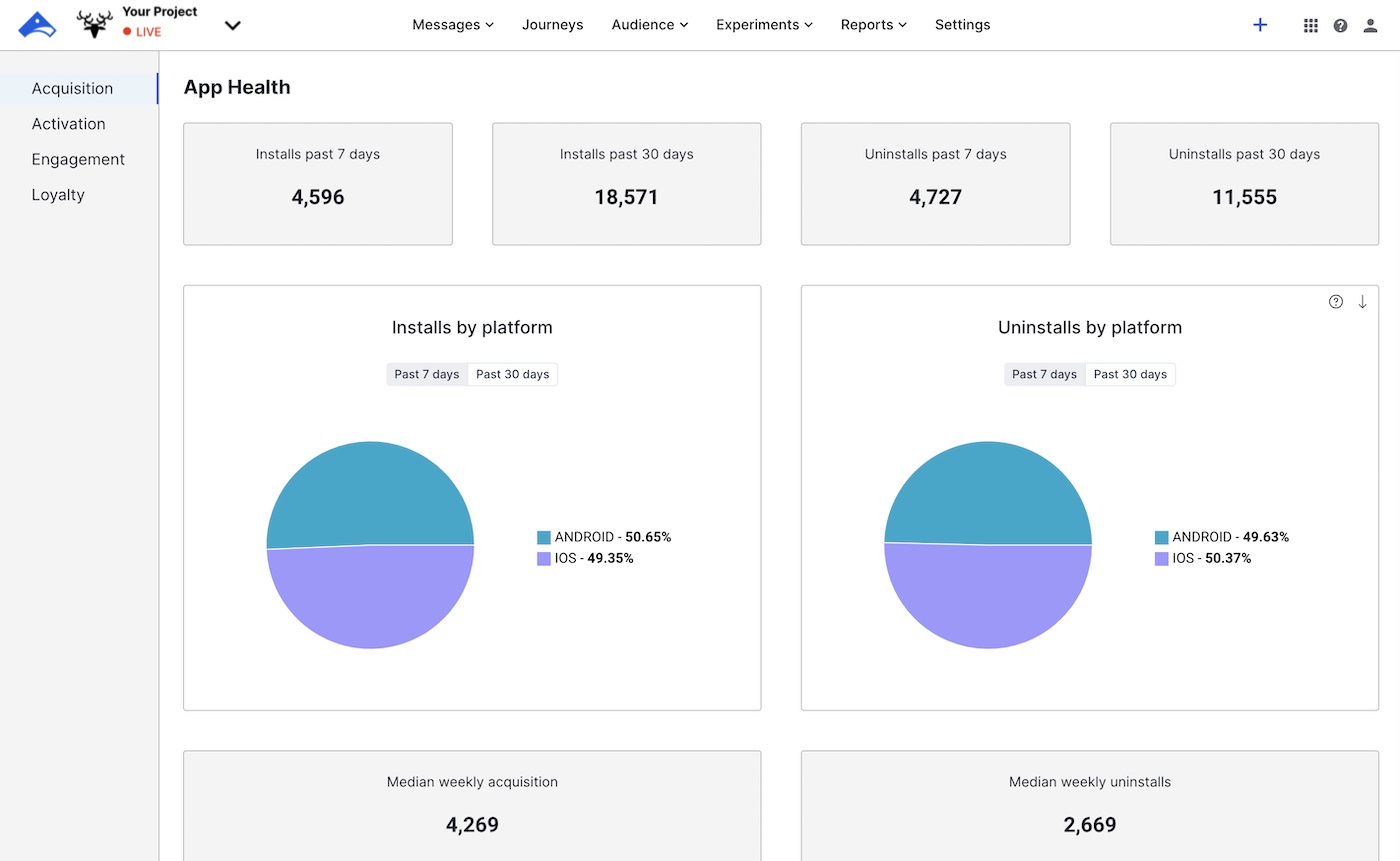
Select the Reports menu, then select App Health. Select a lifecycle stage in the sidebar and check out the reports:
Acquisition — Installs, uninstalls, and net gain show how your audience is growing.
Activation — View the daily active user count and activation rates for users who installed your app within the last 30 days. View opt-in rates for both push notifications and specific Subscription ListsAn audience list of users who are opted in to messaging about a specific topic. Users can manage their opt-in status per list using a Preference Center. for your entire app audience.
Engagement — Learn about your active users and their app sessions. Daily, weekly, and monthly counts, engagement score, engagement with app messages, and more. App session reports show how many sessions are happening, when, and for how long.
Loyalty — View opt-in and retention rates over the last 90-120 days.

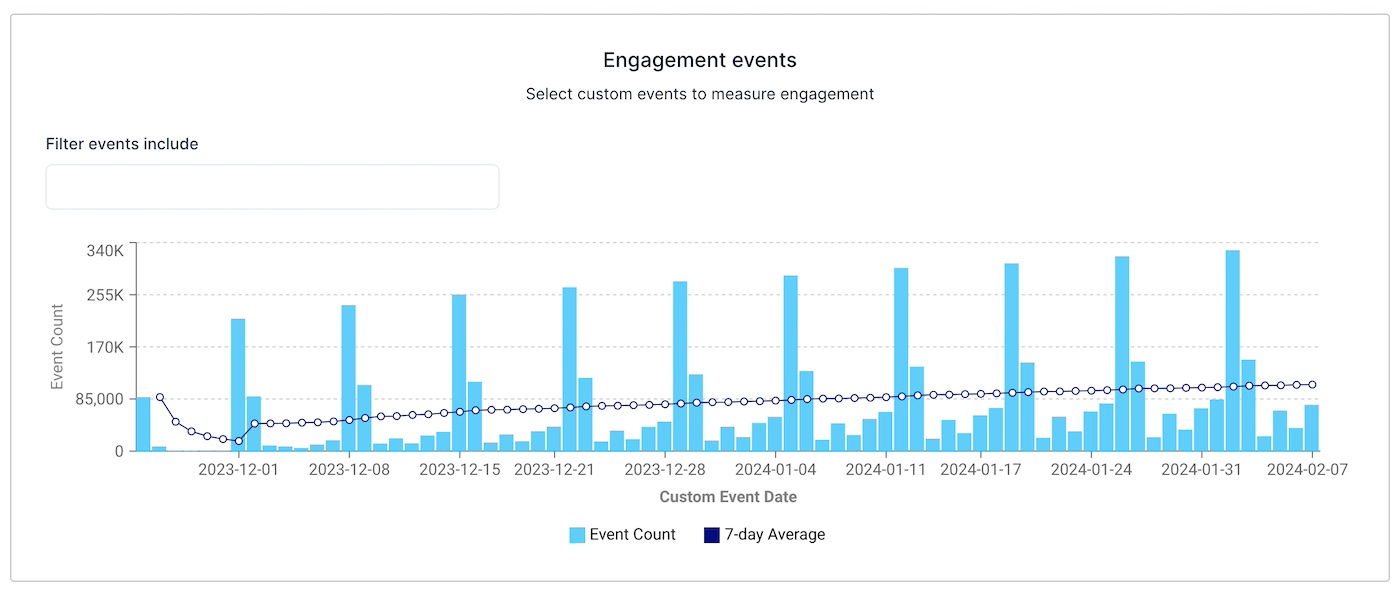
The last report in Engagement and Loyalty displays a daily count of all Custom EventsEvents that indicate that a user performed a predefined action, such as adding an item to a shopping cart, viewing a screen, or clicking an Unsubscribe button. Custom Events can trigger automation, including Sequences and Scenes. You can code them into your app or website, or send them to Airship from an external source using the Custom Event API. Custom Events contain properties that you can use to personalize messages. over the last 90 days, with a 7-day smoothed average. Enter an event name to filter the report for relevant events you’d like to measure. The same report is also in Activation, pre-filtered for Custom Events containing “login” in the name.

For report definitions, hover over a report, then hover over the question mark () icon. To download, hover over a report, select the download icon, then save as a CSV or TXT file.
Requirements
The App Health dashboard requires Performance AnalyticsA customizable marketing intelligence tool that provides access to reports and graphs based on engagement data., which is included in all current AXP plans. Non-enterprise customers can upgrade to AXP Essentials in the dashboard. To upgrade to AXP Enterprise or add Performance Analytics to another enterprise plan, contact Airship Sales.
If a project does not contain Custom Events or Subscription Lists, reports for that data will not appear. Reports that require data older than 90 days will not appear for accounts without 13 months’ retention for Performance Analytics.