 May 16, 2022
Multiple Triggers and UX Updates for Journeys
Set up multiple triggers to initiate Journeys in Airship.
The message series component of a journey is now labeled Sequence. See the announcement.
In addition to the new ability to initiate a JourneyA series of messages that is initiated by a trigger. Airship sends messages in the series based on your timing settings, and you can also set conditions that determine its audience and continuation. Sequences can be connected to each other and to other messaging components to create continuous user experiences in a Journey. based on more than one trigger, we made improvements to make it easier to create and edit in the Journey MapA visualization of messaging components that can be connected to create a continuous user experience. You can also create and edit from the map..
Multiple triggers
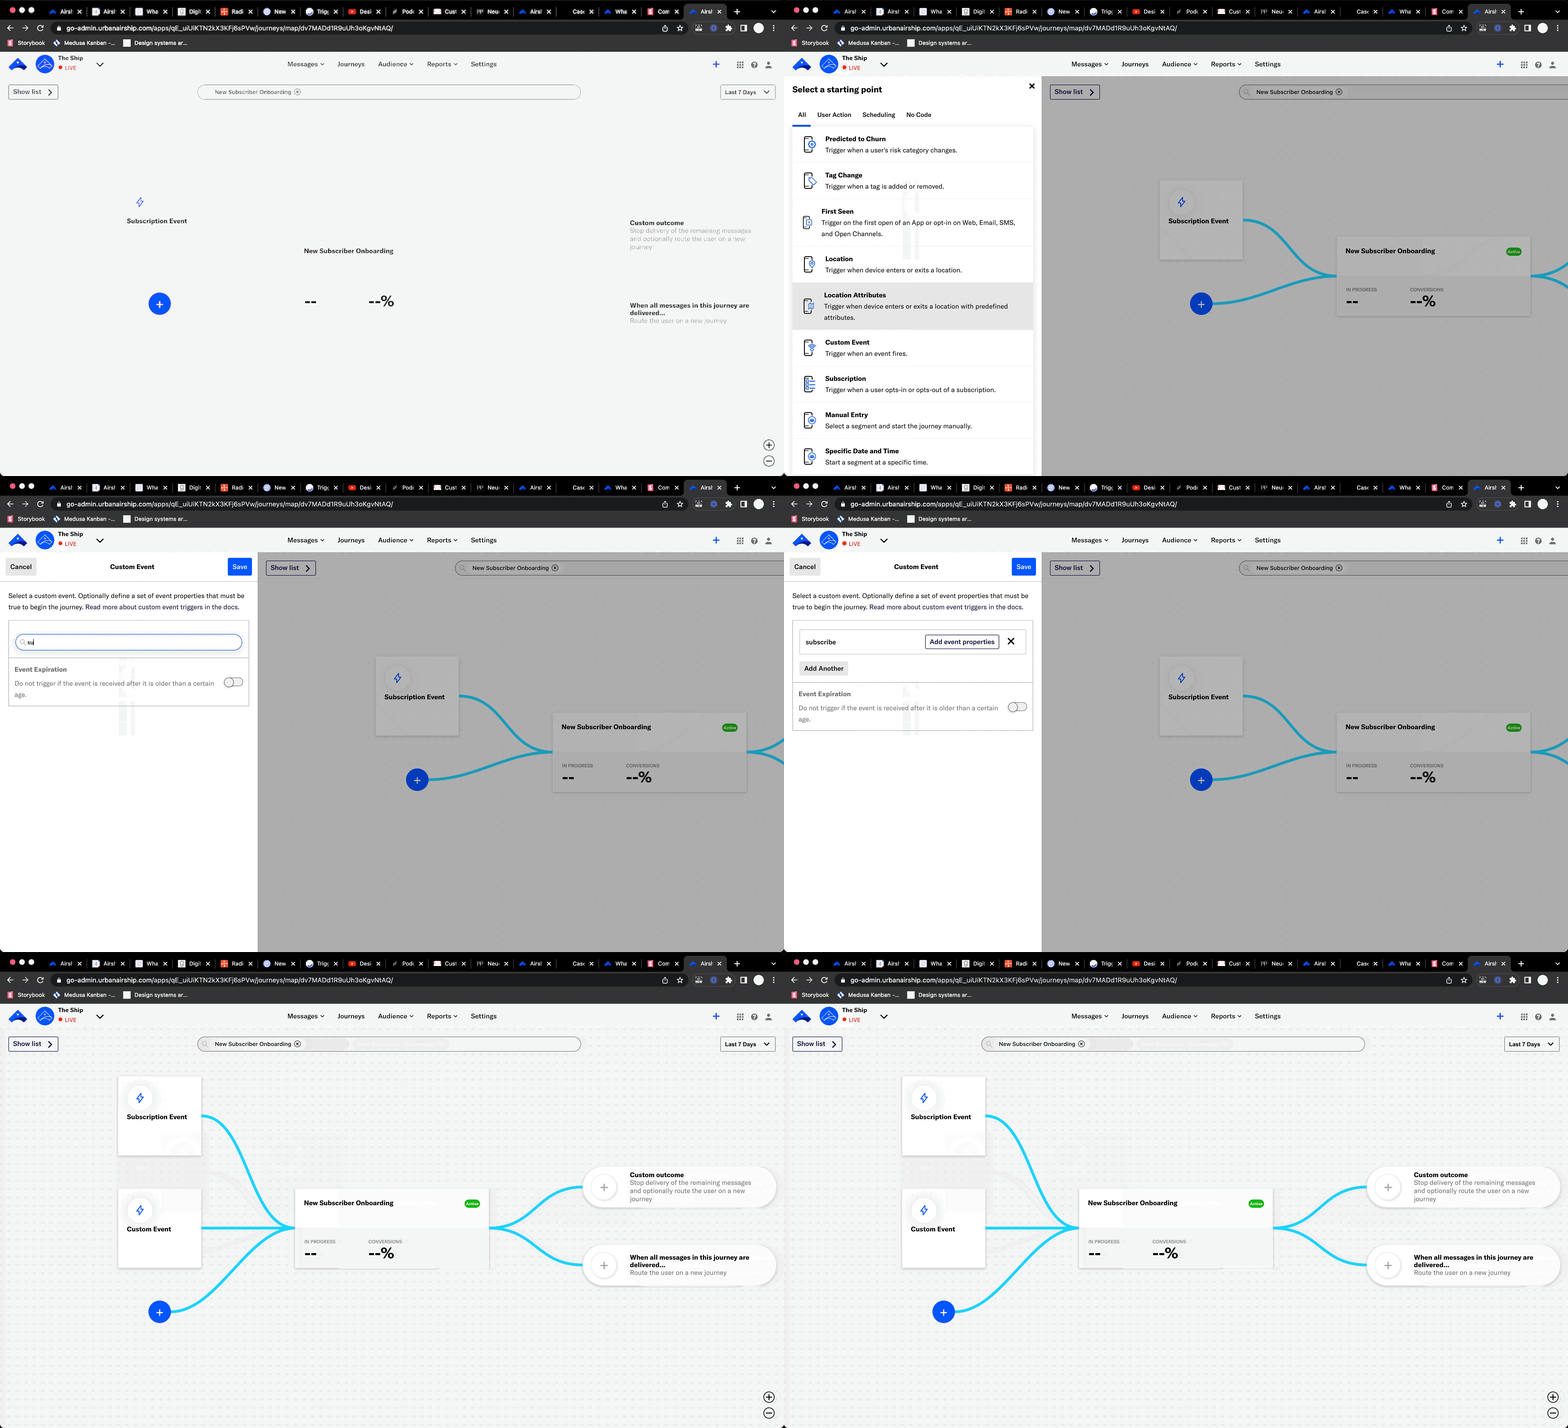
You can configure multiple triggers in the journey map.
- Go to Journeys and select a journey.
- Click its trigger card.
- Click Configure.
- Select and configure a trigger.
- Click Save.
To add another trigger, click below a configured trigger. Adding more triggers to an existing journey does not require publishing changes.
You can also now remove a trigger from a journey: Click a trigger card for a journey in the map and click Remove.
Documentation: Journey triggers
Trigger setup location
Previously: Triggers could be configured in the map or the journey composer.
Now: Triggers are configured in the map only, but trigger options (start/end dates and frequency limits) are still configured in journey settings.
Documentation: Create a journey
Direct link to the journey map
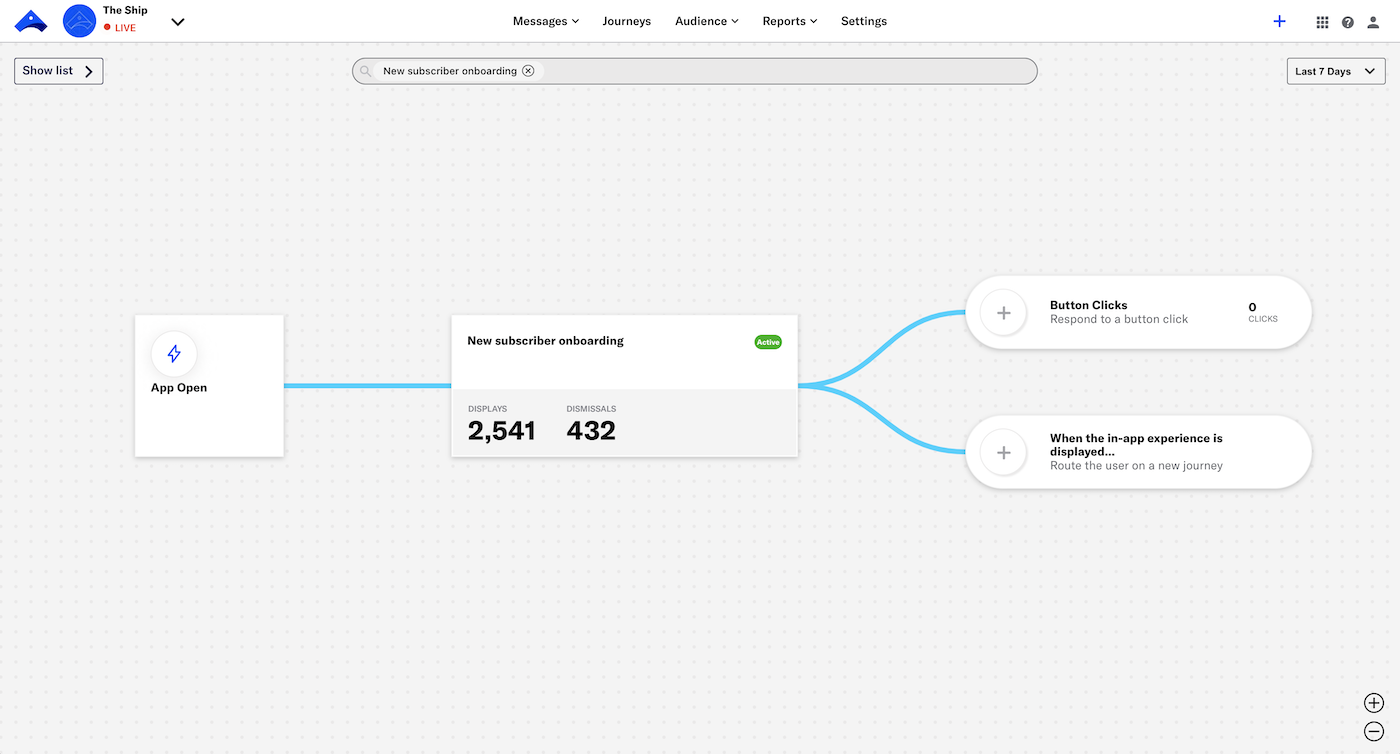
Getting to the journey map is now a single click in the dashboard header.
Previously: Clicking Journeys in the dashboard header opened the Overview page.
Now: Clicking Journeys in the dashboard header loads the journey map.
We also removed the Overview and Explore & Learn pages. You can perform the same actions in the map as you did from Overview, and you can also do so from Messages OverviewA view of all your project’s messages, with options for editing their settings, content, status, and more..
Documentation: Journey map
Creation starting point
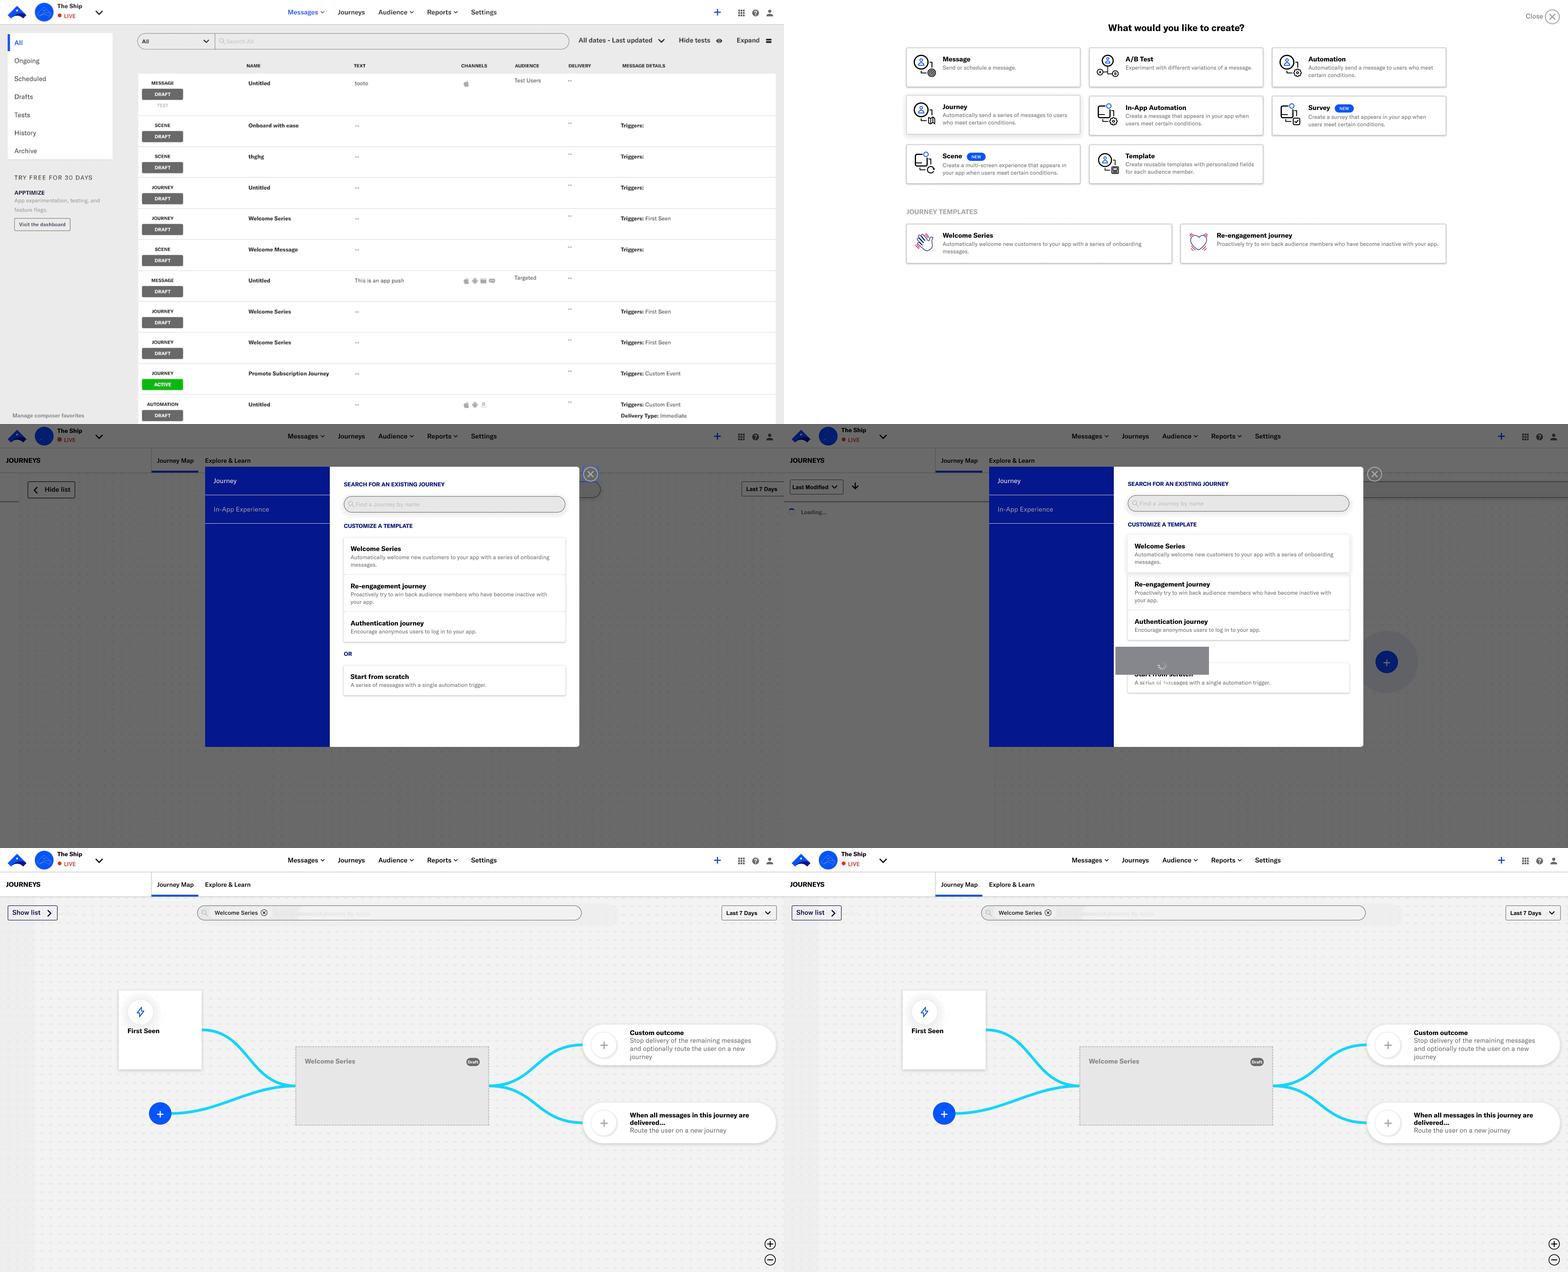
Previously: Clicking in the dashboard header and selecting Journey opened the Journey composer.
Now: Clicking in the dashboard header and selecting Journey opens a modal window in the Journey MapA visualization of messaging components that can be connected to create a continuous user experience. You can also create and edit from the map.. This is the same experience as clicking in the journey map.
From the modal window you can search for a journey, or create a new journey using a template or from scratch. You can also select In-App Experience and create an In-App AutomationMessages cached on users’ devices and displayed when users meet certain conditions within your app, such as viewing a particular screen or opening the app a certain number of times., SurveyA question-and-answer experience used to collect and aggregate feedback or generate a net promoter score. The Survey composer was deprecated September 9, 2024. All Survey composer functionality is available in Scenes., or SceneA mobile app or web experience of one or more screens displayed with fully native UI components in real time, providing immediate, contextual responses to user behaviors. Scenes can be presented in full-screen, modal, or embedded format using the default swipe/click mode or as a Story. They can also contain survey questions..
Documentation: Create a journey
Status indicators in map cards
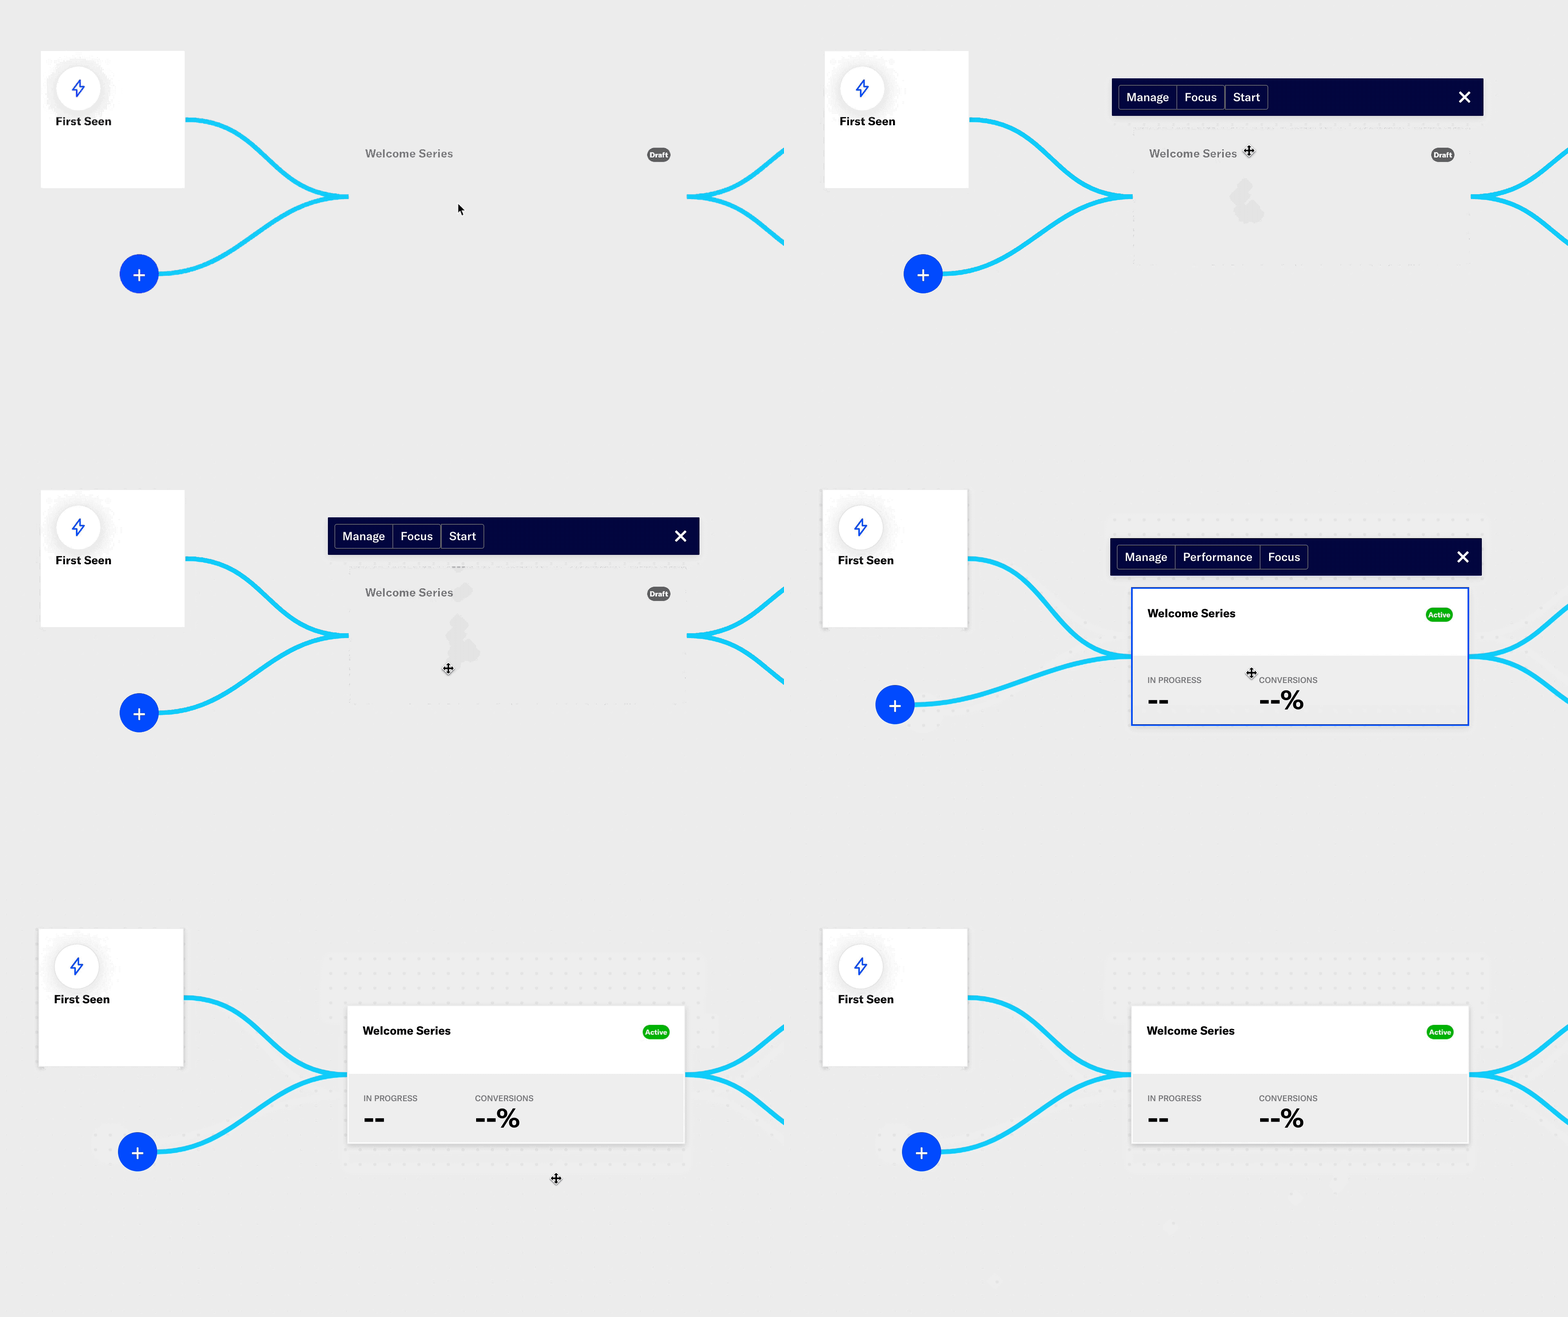
Previously: Journey status was not clearly indicated in the map.
Now: The map cards for journeys show obvious states:
Draft — The card is greyed-out, labeled Draft in grey, and does not display statistics.
Started — The card is not greyed-out, is labeled Active in green, and displays statistics.
Paused — The card is not greyed-out, is labeled Paused in orange, and displays statistics.
Documentation: Map cards
Default reporting time frame
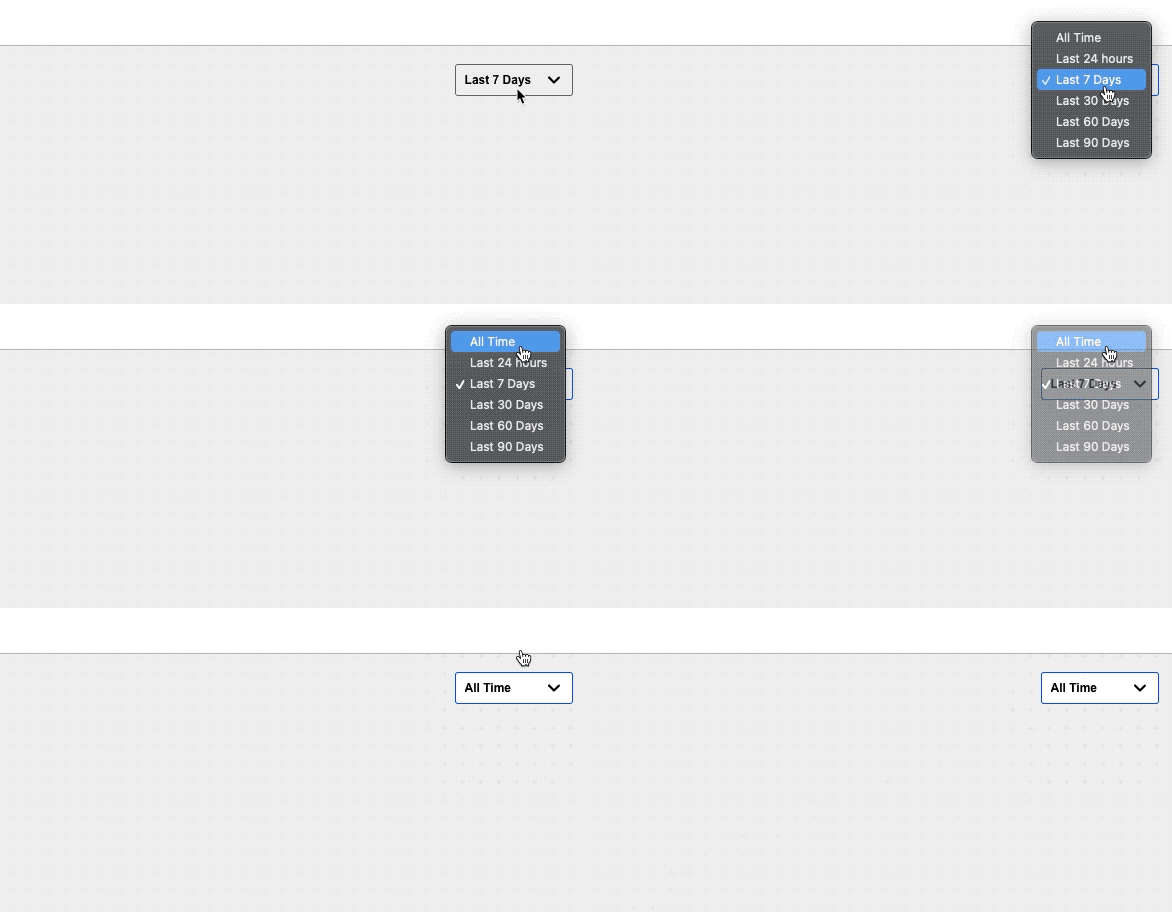
Previously: For statistics displayed in the map, the default time frame was All Time.
Now: For statistics displayed in the map, the default time frame is Last 7 Days.
It’s easier to see performance changes with a smaller time frame selected, and we want to ensure that you are able to notice improvements or issues early. All Time can still be selected from the time frame menu.
Documentation: Map cards
Categories
