Engage: Reports Improvements
Statistics Report
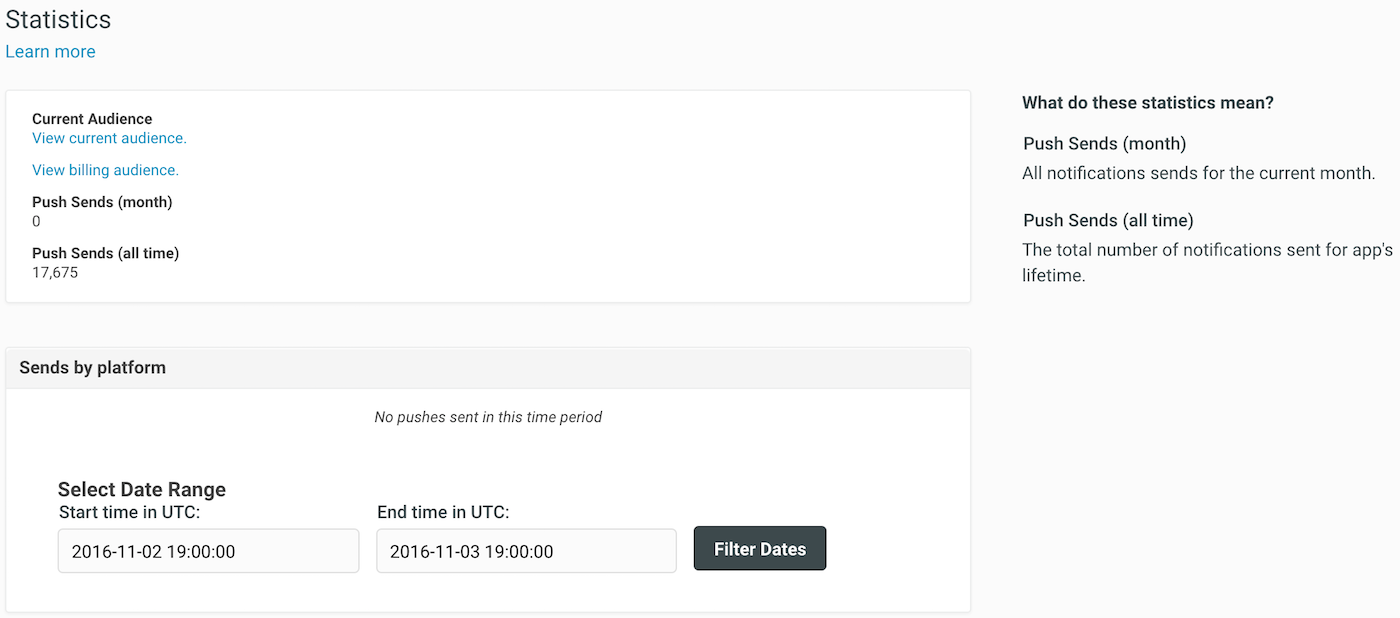
The (app) Statistics Report has been updated, with better presentation of metrics and new tooltips with relevant help text. The updated Statistics Report provides greater context and serves as a simple, current snapshot of your app’s installations and notification sends:

Push Response Report
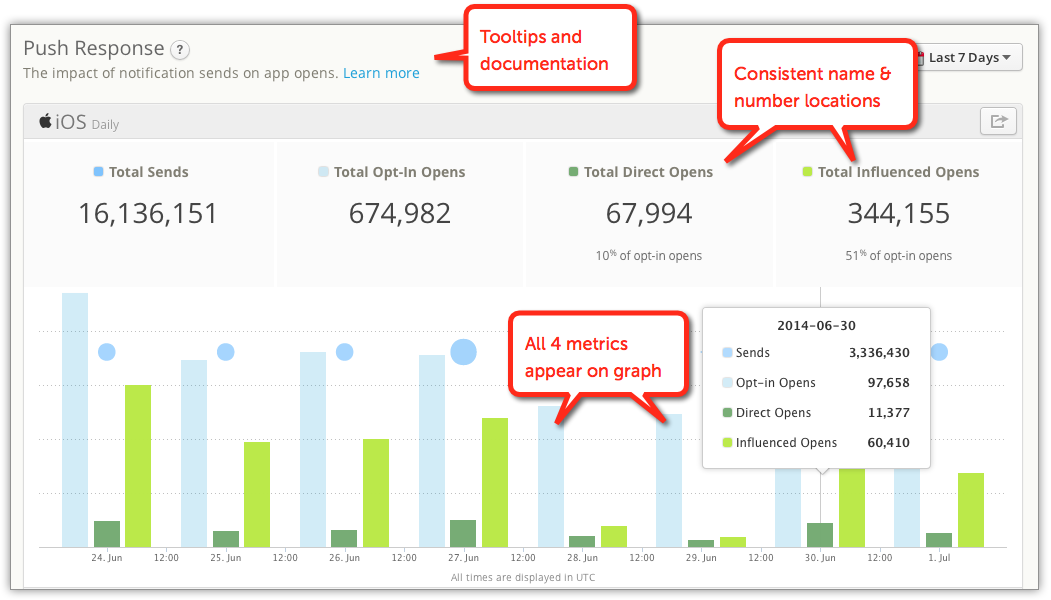
The Push Response Report has been updated to present a more streamlined visualization of app open attribution.
The new Push Response Report design presents the total Opt-in Opens

Devices Report
To improve clarity between billing metrics and the app analytics reports, the “Audience Report” has been renamed to “Devices Report.” This report still shows unique devices, and per-platform opt-in data. The name now reflects the application of this data, and removes the ambiguity between daily snapshots (Reports), and the monthly roll-ups (“Audience” numbers used for billing).
CSV Exports
Across all of the reports, we’ve improved the CSV downloads to make it easer to crunch the numbers using other systems. The “Export CSV” button will still provide all the data to which users are accustomed, and now in addition:
Header rows have been turned into columns, for use in reports and pivot tables (e.g. Send Time)
New columns including App Name, App Key, and Push ID to make it easier to combine data across multiple apps
Improved and unified date formats that parse correctly in Excel
Tooltips, Descriptions & Docs
Like the Push Response Report, all of the aggregate app reports (e.g., Push Sends, App Opens, Time in App, and Unique App Opens) have new subtitles explaining their value, improved tooltips, as well as links to updated documentation.
Categories
