Engagement Reports
Engagement reports explain aggregate user engagement activity, response rates, and important high-level statistics such as opt-in/opt-out and uninstall levels by platform.
Go to Reports and select a report. With the exception of the Event Tracking report, which displays custom events for any platform, reports show data for iOS, Android, and Amazon only. Date range and export options vary per report.
Click for Print and Export CSV options. If export is the only option, you will see Download CSV instead.
Hover over a chart’s data point to display its value. For some reports, you can click the data point to narrow the displayed date range.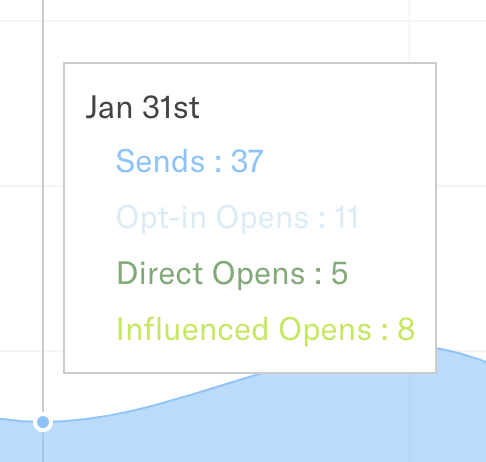
Most reports default to Last 7 days. You can change the range using the Date filter. The time frame shown in the report chart is based on the time you entered the request. Due to time zone differences, the date range displayed at the top of the chart may not correspond exactly with your selected date range.
| Date range | Data displayed |
|---|---|
| Last 7 Days | Dates for today and the previous 7 days will display on the horizontal axis, with data shown for each day. |
| Last 2 Weeks | Dates for today and the previous 14 days will display on the horizontal axis, with data shown for each day. |
| Last 30 Days | Dates for today and the previous 30 days, in increments of 4 days, will display on the horizontal axis, with data displayed for each day by clicking the data point in the graph. |
| Last Month | Dates for the current month, including today, will display on the horizontal axis, with data shown for today and each day back to the beginning of the current month. |
| Last 3 Months | The current and 3 previous months will display on the horizontal axis, with data shown by month. |
| Last 12 Months | The current and 12 previous months will display on the horizontal axis, with data shown by month. |
| Today | Based on the time you entered the request, hourly increments will display on the horizontal axis, ending at the previous hour and going back to midnight. |
| Yesterday | Based on the time you entered the request, hourly increments will display on the horizontal axis, ending at the previous hour and going back to midnight the previous day. |
| Custom range | See Custom range table below. |
| Custom range | Data displayed |
|---|---|
| Same dates in ‘From’ and ‘To’ | If you selected a day other than today, hourly increments from midnight to 11 PM will display on the horizontal axis. If you selected today, hourly increments will display on the horizontal axis, ending at the previous hour and going back to midnight. |
| Yesterday’s date in ‘From’ and today’s date in ‘To’ | 4-hour increments will display on the horizontal axis, beginning at midnight of the previous day and ending at the previous hour, with data displayed for each day by clicking the data point in the graph. |
| A 3-day period with a date previous to today in ‘To’ | Beginning at midnight on the date in the ‘From’ field of the selected date range, the time will display on the horizontal axis in 4-hour increments, ending at the previous hour, with data displayed for each day by clicking the data point in the graph. |
| A 3-day period with a date previous to today in ‘To’ | Beginning at midnight on the date in the ‘From’ field of the selected date range, the time will display on the horizontal axis in 4-hour increments, ending at midnight on the date in the ‘To’ field. |
| A 4-day or longer time period ending with today’s date in ‘To’ | In 4-day or longer increments, data will display by the day. |
App Metrics
Reports » App Metrics assesses app activity: sends, app opens, and time in app.
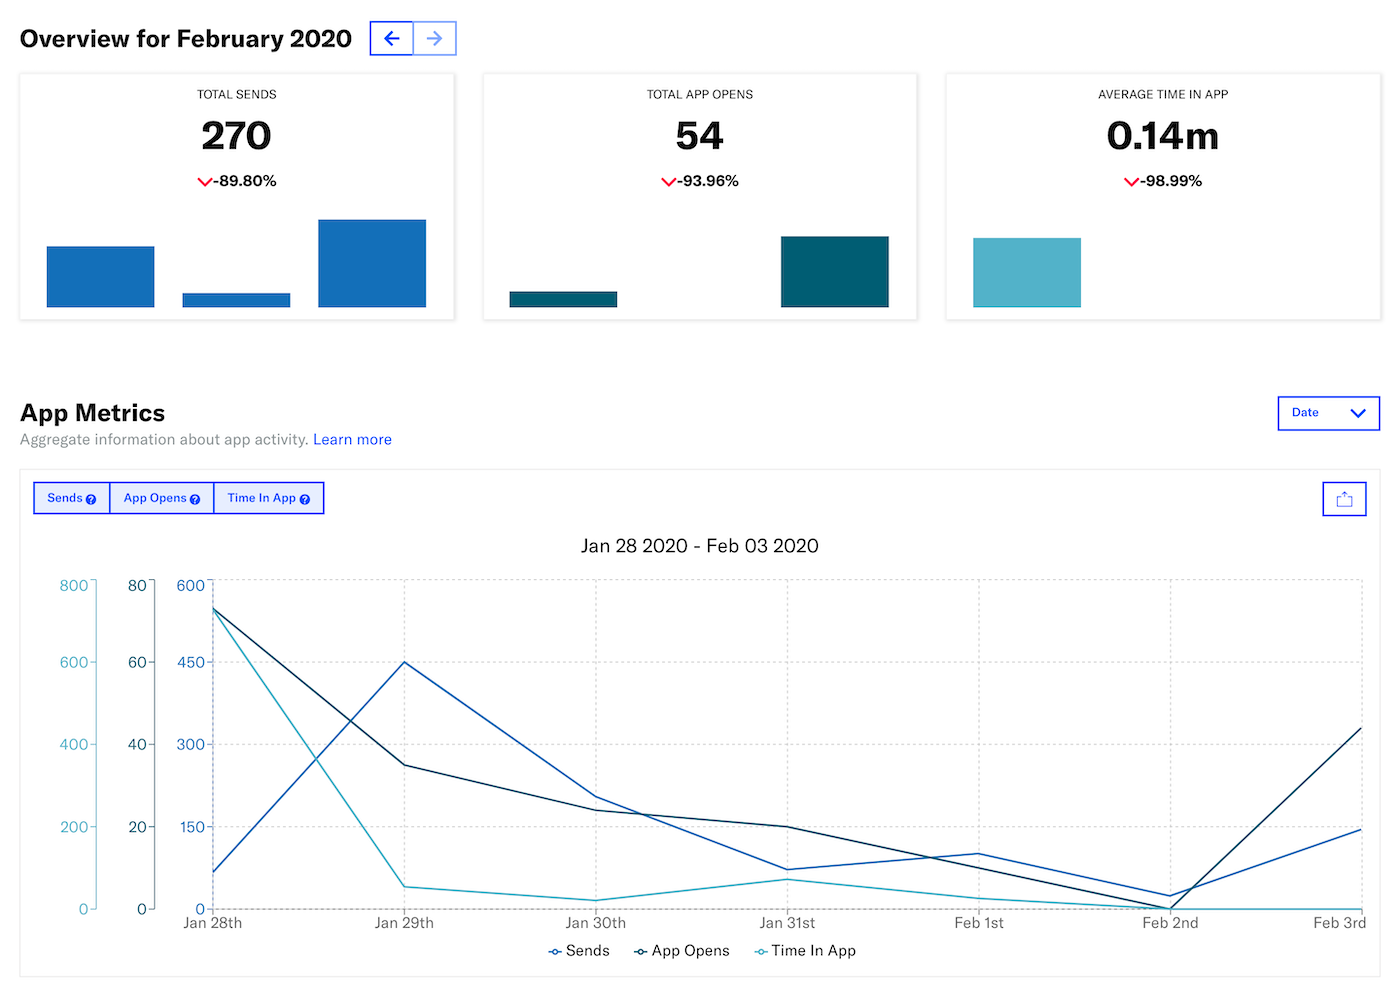
Three panes display individual metrics for the current month to date. Hover over the trend chart in a pane to see metrics per day. Click the arrows to change the month.
Total Sends: Monthly total to date, percentage change from prior month, daily trend. Count includes alerting sends only; silent sends (via silent push notifications) are ignored.
Total App Opens: Monthly total to date, percentage change from prior month, daily trend. Count includes repeated app opens by individual users. To see the number of unique users that have opened your app, see the Unique App Opens report.
Average Time In App: Average number of minutes per user session, percentage change from prior month, hourly trend. Airship collects this data from user session events and measures it in seconds. Though behavior varies by operating system, we calculate this from events received each time your app is opened, brought to the foreground, or sent to the background.
A chart displays combined metrics. Toggle displayed data by clicking Sends, App Opens and Time In App in the upper left corner of the chart.
View Time In App with Sends to see the influence your message may have had with users’ session length.
Sends counts notifications rather than total pushes sent, so rich messages are included in the report only if:
- The users receiving the messages have opted-in to push notifications, and
- The messages include a notification, e.g., a badge, sound, alert text, etc.
To view the total number of rich messages delivered, see Message Reports.
An increase in Sends often corresponds to a decrease in the Time In App metric. An increase in sends may cause your audience to open your app more often, but opens from push notifications can be very short, i.e., just long enough to read the message or perform a short action).
Devices
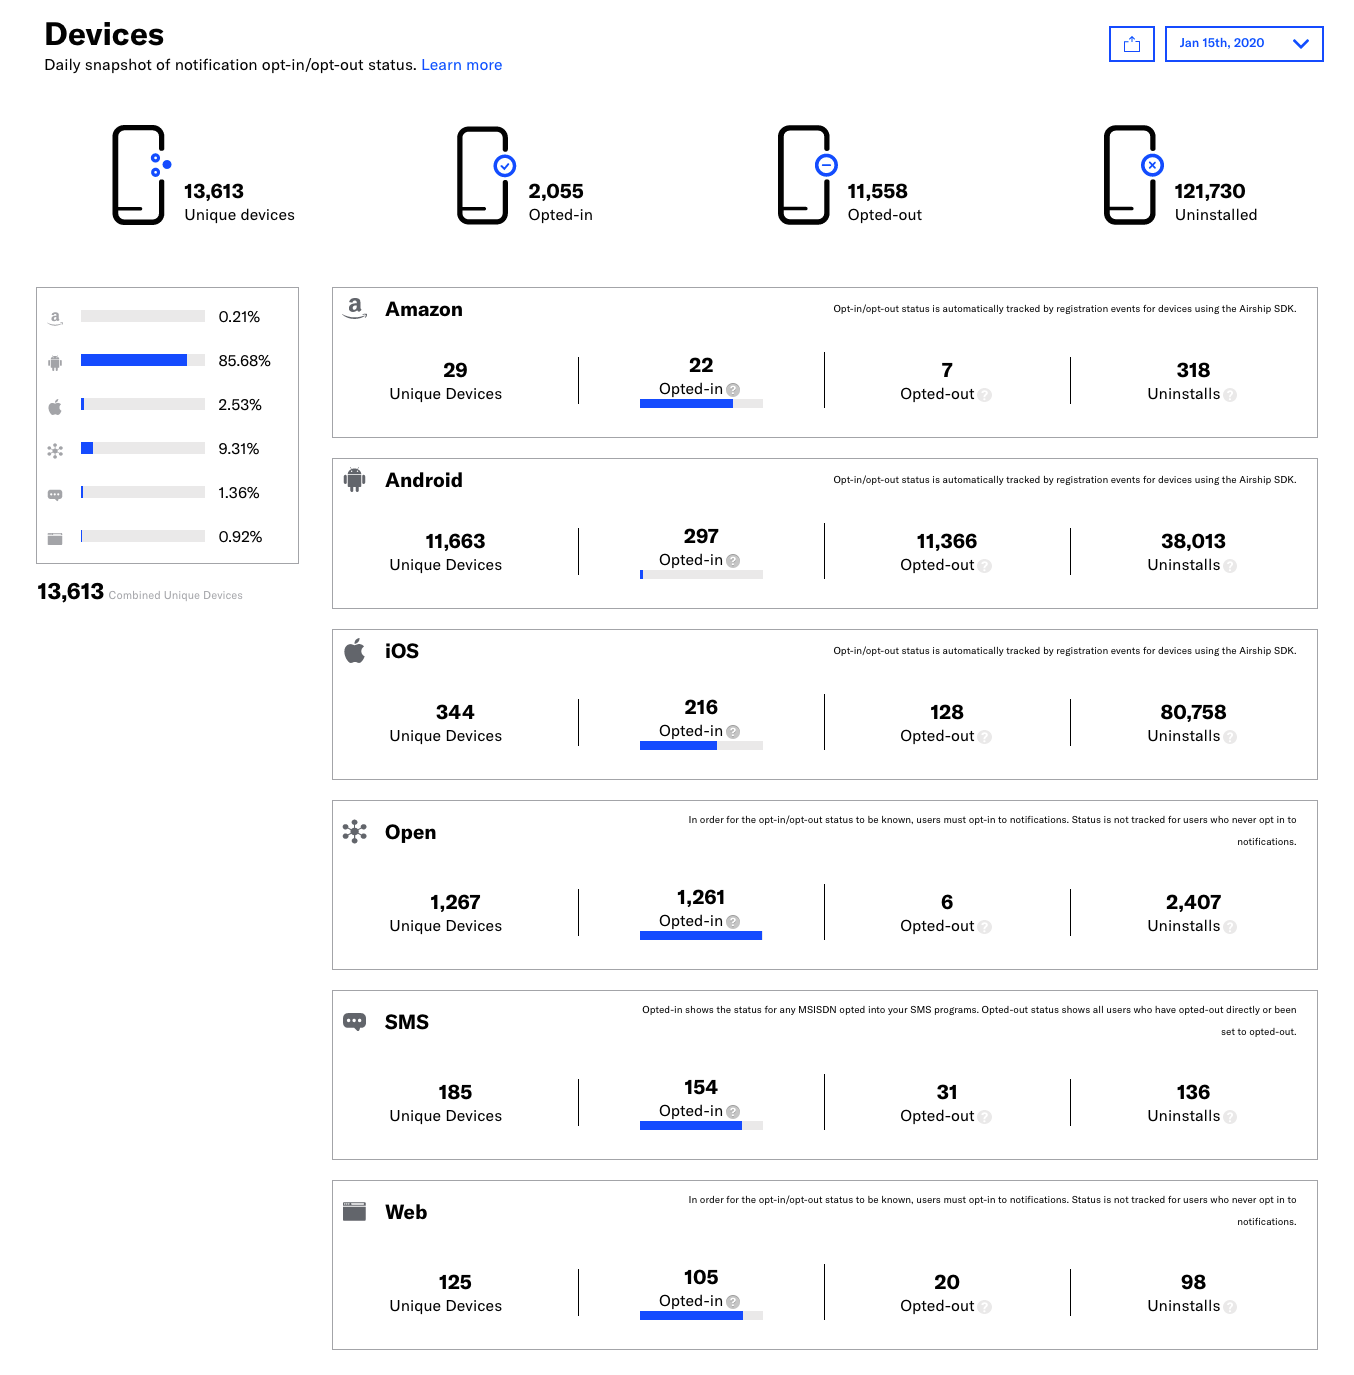
Reports » Devices provides a current view of your audience by the number of devices opted in to and out of notifications. This report is generated daily. For the purposes of this report, a web browser is a “device.”
The registration call that returns opt in/out status is slightly different for apps vs. browsers:
Apps: On initial app open, a channel ID is created for the user and is registered with Airship, passing along segmentation info, i.e., tags, and opt-in/out status. On subsequent app opens, registration calls are made, passing the current metadata and opt-in/out status.
Browsers: A registration call to Airship is made when the user initially opts in to web notifications. This initial registration passes device metadata and opt-in status to Airship. See: Web: User Registration.
Once we receive the event, we record the status, which is reflected in the next day’s report.
Unique Devices: Total number of devices that have opted in or opted out of push notifications. The Unique Devices count does not include uninstalled devices. If your app only supports one platform, Combined Unique Devices is not displayed.
Opted-in: Devices with notification permissions on.
Opted-out: Devices with notification permissions off. For web, this only includes users who had previously opted in to web notifications. For SMS, opt-outs occur by sender ID, so a user might opt out of one program but still have an MSISDN known to your project.
Uninstalled: Amazon/Android: Number of app uninstalls observed from opted-in devices.
Uninstalled: iOS: Number of app uninstalls observed from either opted-in devices or devices with background app refresh enabled.
Uninstalled: Open: Number of successful calls to the open channel Uninstall API.
Uninstalled: SMS: Number of MSISDNs that have been uninstalled. This happens automatically for any MSISDN on the carrier deactivation lists. Users can “uninstall” when a carrier deactivates a handset, or if a user requests that their account is deleted in accordance with GDPR regulations. In this case, the user is not only opted out, but their MSISDNThe mobile phone number of an individual in your Airship audience. Each MSISDN represents an individual mobile device. and Airship channel ID are removed from Airship entirely.
Uninstalled: Web: Number of users who have opted out of web notifications via browser settings and have not returned to your website.
See Detecting Uninstalled Devices for information about the nuances related to the Uninstalled metric.
The Devices report requires that analytics be enabled in the SDK. Analytics are enabled by default, and disabling them renders certain features, e.g., reports or location triggers, useless. See the Analytics and Reporting sections of the SDK documentation for information about enabling analytics:
The total devices count in Message Reports may differ from the total devices count listed in the Devices report. This may be due to but is not limited to:
- Additional platforms supported beyond iOS and Android.
- Devices registered via the server.
- Timing of when the Devices report is generated and when a user opens your app for the first time or uninstalls your app.
Use the CSV Download to save daily snapshots and perform custom comparison. For example, if you’d like to see how many people have opted in to your app for the first full week in January, download the January 5th and January 11th reports, open the files in a spreadsheet app, and calculate the difference in device counts.
Detecting Uninstalled Devices
When you send a push notification to a device that has uninstalled your app, Airship receives feedback from the platform push service (APNs or FCM) that the device is inactive. When we generate the daily Devices report, we remove the device from the Unique Devices total and opt-in/out status breakdown, and add it to the Uninstalled count.
Uninstalls are detected by either:
- A standard push notification, sent to iOS or Android devices, or
- A background push using the
content-availableflag, sent to iOS devices.
A device must have push enabled so that it can receive the notifications you send. Also keep in mind that users can prevent receiving background pushes by disabling the Background App Refresh option in their phone’s settings.
To send background pushes, first
enable it in your application,
then send an empty push notification that has the content-available flag
enabled:
API: See iOS Platform Overrides for information about using the
content-availableflag.UI: Enable Background Processing to use the
content-availableflag. See: Optional Features: Background Processing.
- In order to receive uninstall feedback, a device must have a registered push address in Airship.
- For users opted in for background push only, you must send background pushes to get uninstall counts.
- Since there are two detection methods for iOS, the iOS Uninstalled count can include 1) devices that were opted-in to push and 2) opted-out devices that have background push enabled.
If a user re-installs the app and opens it, the device is moved out of the Uninstalled count and placed back in the Opted-in/out count.
Uninstalls are determined by these two methods only. For instance, a Rich Message sent without a push notification would not receive uninstall feedback.
Web Browsers
When you send a push notification to a web user, their opt-in status is returned to Airship via the push service, e.g., FCM (Chrome) or Mozilla (Firefox).
A user is considered to be Uninstalled if they have both:
- Opted out via the browser settings, AND
- Not returned to the website.
When we generate the Devices report, we remove the device from the Unique Devices total and opt-in/out status breakdown, and add it to the Uninstalled count. If the user opts out via the browser settings and does return to the website, we instead include the device in the Opted-out count.
If the user again opts in to notifications, we remove the device from the Uninstalled count and add it back to the Opted-in count.
See Web: User Registration for additional information about registration status and options.
Reports » Email aggregate email notification information for your entire Airship project and per campaign categoryAn optional delivery feature used to group messages of similar types or messaging strategies for aggregate reporting. Campaigns help you track the efficacy of both your individual messages and a messaging campaign as a whole.. Percentages are based on the total number of notifications sent.

Sent: Total number of messages sent to users.
Delivered: Percentage and number of messages accepted by the recipient’s mailbox provider for delivery. This count does not include messages that were accepted by the mail server but bounced before delivery. See note below regarding Bounced Messages.
Opened: Percentage and number of times messages were displayed. This is a raw count, not per unique user.
Clicked: Percentage and number of clicks on tracked links. This is a raw count, not per unique user. Unsubscribe link clicks are excluded from these metrics.
Bounced: Percentage and number of bounced messages, for all reasons. See note below regarding Bounced Messages.
Unsubscribed: Percentage and number of unique users who unsubscribed via unsubscribe links in your emails.
Complained: Percentage and number of spam complaints.
Bounced Messages
Mail servers generally process messages as they are received, either accepting for delivery or rejecting (bouncing) them.
Some mail servers, however, first accept all incoming messages and later process bounces and inbox delivery. The Email report’s Delivery count does not include messages that were accepted by the mail server but bounced before delivery to the recipient inbox.
Event Tracking
Reports » Event Tracking is an aggregate view of your Custom EventsEvents that indicate that a user performed a predefined action, such as adding an item to a shopping cart, viewing a screen, or clicking an Unsubscribe button. Custom events can trigger automation, including Sequences, Scenes, and Surveys. You can code them into your app or website, or send them to Airship from an external source using the custom event API. Custom events contain properties that you can use to personalize messages.. This report shows custom events associated directly with ChannelsAn instance representing an entity addressable via the Airship service, e.g., an iOS device, email address, SMS number or web browser. The channel instance or channel object contains all relevant information about a channel, including metadata used for targeting, opt-in status, device-specific information, and, importantly, a unique identifier for the channel, the channel ID. and events associated with Named UsersA customer-provided identifier used for mapping multiple devices and channels to a specific individual..
Event Name: Human-readable name assigned to a particular custom event.
Notification Attribution: Displays whether your event was directly or indirectly attributed to the push notification.
Location: The source from which the event originates, most commonly one of Interactive Notification, Message Center, Landing Page, or Custom.
Count: Number of instances of this event.
Value: The value (monetary or otherwise) generated by the event.
Avg. Value: Value divided by Count.
% of Total Count: Count divided by the Total Count (listed on the bottom row).
Only events that have been assigned a value within your app project will generate values for the aggregate view. Event values are assigned by you when creating events, and should align with your campaign strategy when considering the respective weights of different activities you seek to measure. The aggregate view is only meaningful when the unit of measure for these activities is the same. See Custom Events for details on Custom Events setup and strategy.
Using Notification Buttons in your message automatically creates Custom Events, where one event is assigned to each button. When viewing the associated Message Reports or the Event Tracking report, you will see a custom event listing for any button that has been pressed.
Goals
Goals are selected events that generate a set of performance reports. They can also be used for measurement in Holdout Experiments. Use goals to measure campaign and program success and understand how your messaging impacts business goals. See also Holdout ExperimentsMeasures the effects of excluding a group of audience members from all messages or messages with specific Campaign Categories. You can compare the performance of the two audience groups in reports for selected goal events..
You can create Goals based on Custom or Predefined Events or these Default Events:
| Event name | Activity name | Definition |
|---|---|---|
| App open | app_open | User opened your mobile app. |
| First open | first_open | User opened your mobile app for the first time. |
| First seen | first_seen | User opted in to notifications or opened your mobile app for the first time. |
| First opt-in | first_opt_in | User opted in to a channel for the first time. For Email (commercial), SMS, and Open channels only. |
| Uninstall | uninstall | User uninstalled your mobile app in response to a push. |
| Web session | web_session | User generated a web session. |
The Goals feature requires Performance AnalyticsA customizable marketing intelligence tool that provides access to reports and graphs based on engagement data., but it is listed separately in the Reports menu. Contact Airship Sales to add Performance Analytics to your Airship plan.
Adding events
You must add Custom and Predefined Events to your project before you can select them for Goals. You do not need to add Default Events to your project before selecting them for Goals.
Creating goals
You can create up to 10 goals per project.
- Go to Reports » Goals and click Create goal.
- Configure fields:
- Goal name — Used for identification in the list of all goals in your project.
- Description — Additional information about the goal.
- Event — Search for and select an event. If the event does not have a category assigned, select from the list or select Custom category and enter a category name.
- Click Create goal.
Viewing goal reports
Go to Reports » Goals and click for a goal to open the reports:
| Report name | Description |
|---|---|
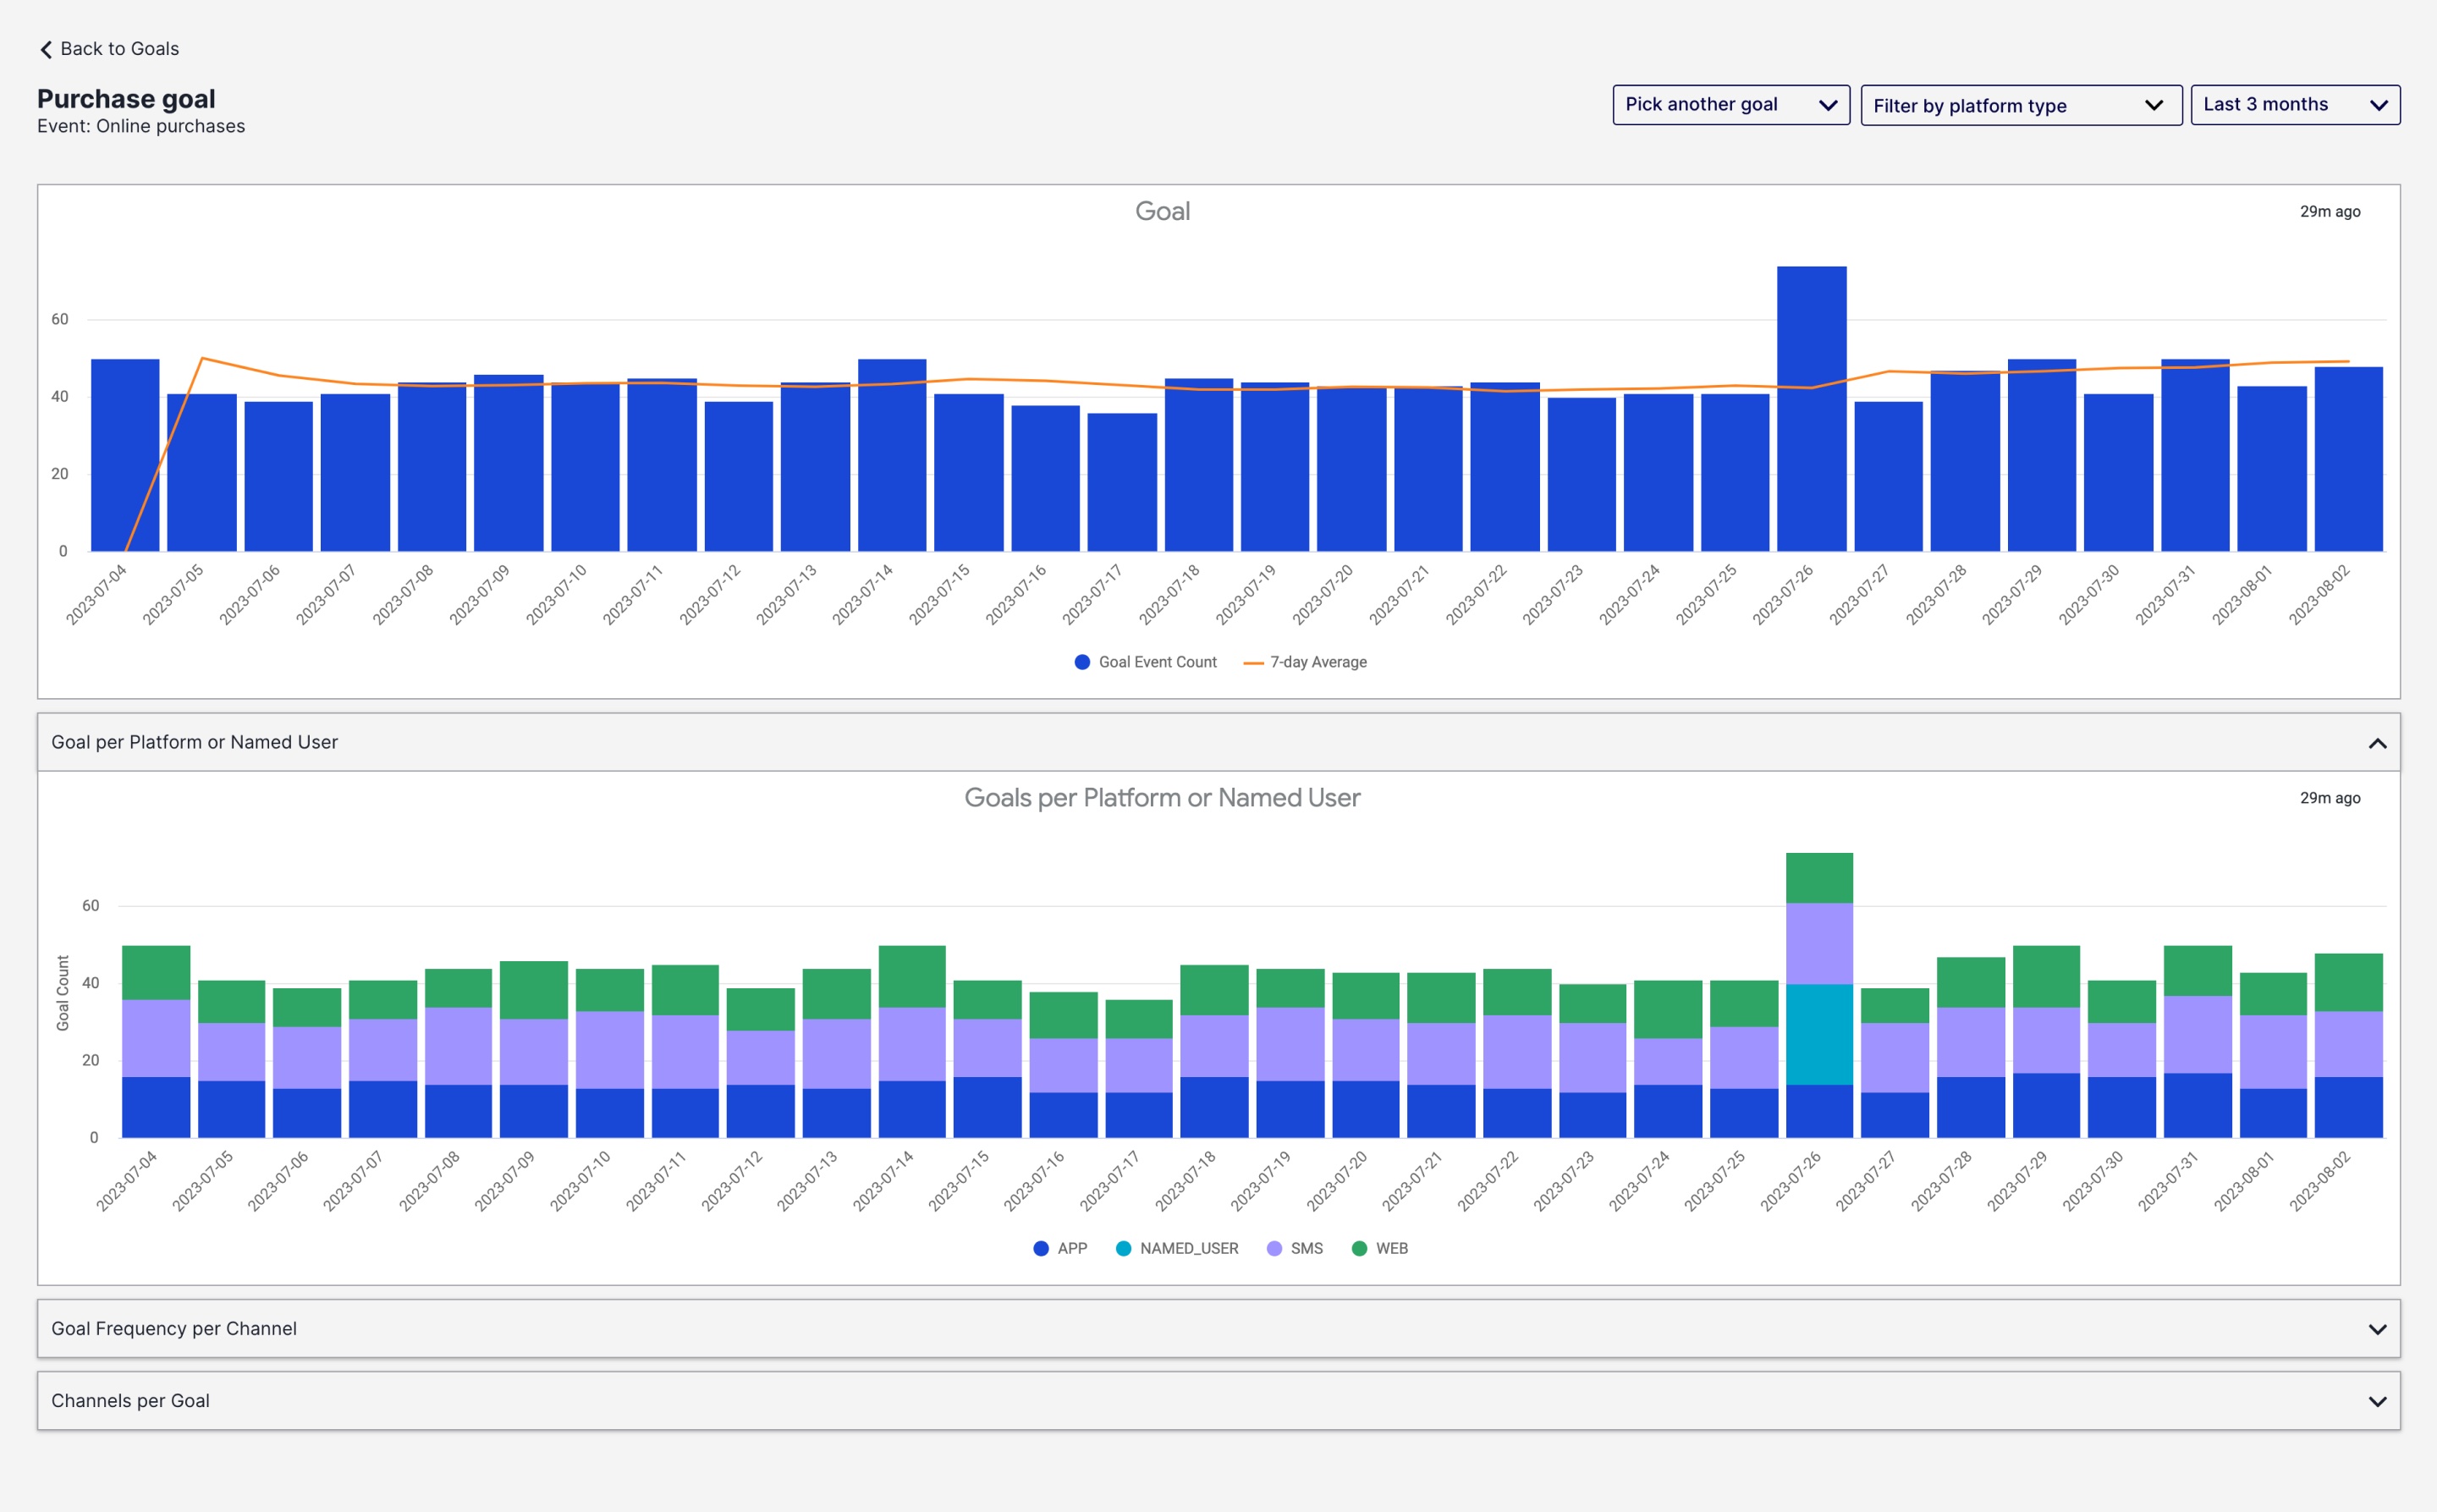
| Goal | The number of times the event occurred per day and the 7-day average. |
| Channels per goal | The number of ChannelsA communication medium supported by the Airship service. Supported channels include app, web, email, SMS, and Open Channels. Within some channels there may be specific platforms with individual characteristics. Example platforms include Chrome for the web channel and Android for the mobile app channel. that performed the event at least one time. You can filter by "greater than or equal to" and "is between" and enter values. |
| Goal frequency per channel | The frequency of event occurrence per ChannelA communication medium supported by the Airship service. Supported channels include app, web, email, SMS, and Open Channels. Within some channels there may be specific platforms with individual characteristics. Example platforms include Chrome for the web channel and Android for the mobile app channel.. Data points displayed: 50th (median), 75th, and 99th percentiles. |
| Goals per platform | The percentage of events that occurred per platform. Only appears if multiple platforms are configured for the project. |
The default view is the last three months of data. You can select a new time frame, and the reports will reload with the data for that period. For reports displaying multiple platforms, you can filter by one or more platforms.
Managing goals
Go to Reports » Goals to view the list of all your goals. Toggle Active/Archived to update the list. The default sort order is by last modified, and each row displays:
- Goal name
- Description
- Event
- Event category
- Date and time last modified (browser local time)
Click to edit a goal’s name, description, and event. Click to archive.
Performance Analytics
See: Dashboard and Look definitions.
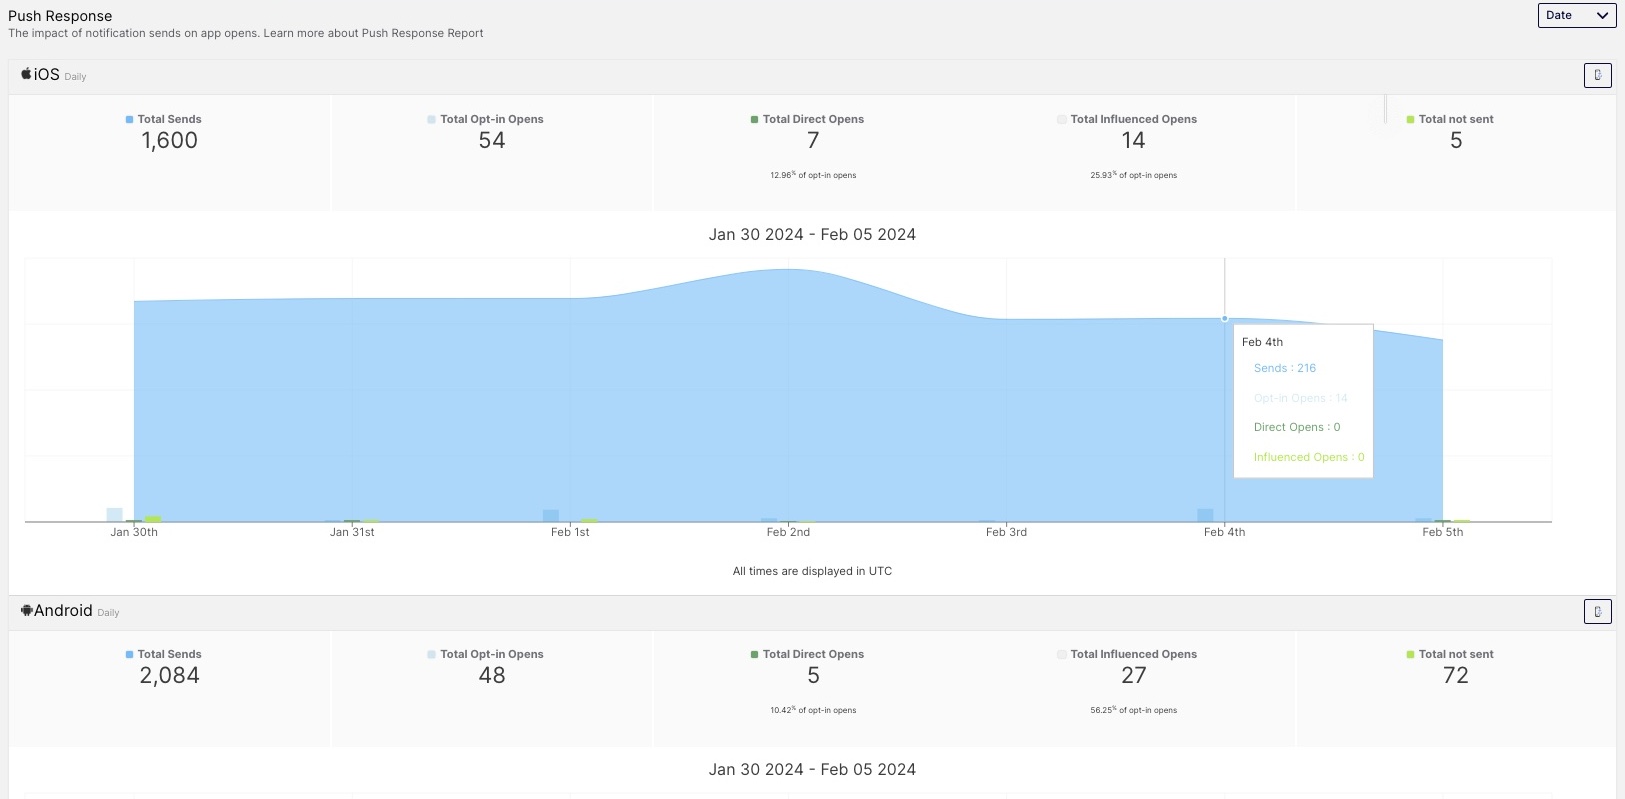
Push Response
Reports » Push Response assesses the impact of notification sends on app opens, with data displayed per platform.
See Appendix: Push Influence Primer and Appendix: Push Response Terminology on this page for supporting information.
SMS
Reports » SMS provides aggregate SMS notification information for your entire Airship project and per campaign categoryAn optional delivery feature used to group messages of similar types or messaging strategies for aggregate reporting. Campaigns help you track the efficacy of both your individual messages and a messaging campaign as a whole.. Percentages are based on the total number of notifications sent. Select a preset date range or set a custom range to adjust the scope of the report.
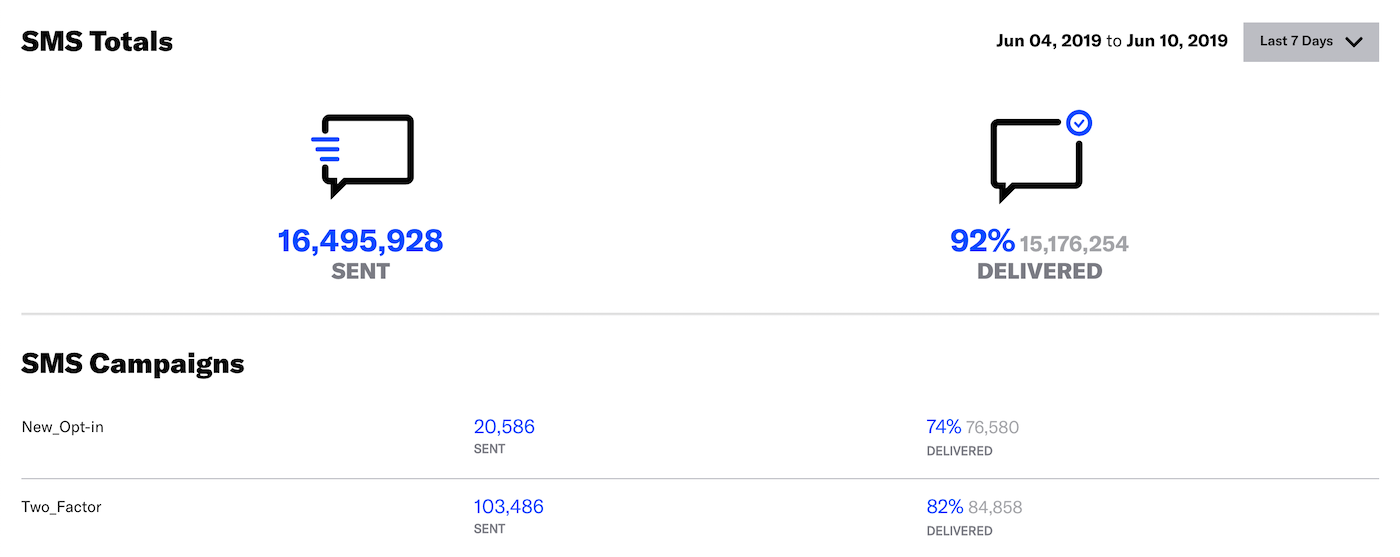
Sent: The total number of SMS messages sent from your Airship project. This number corresponds to your total number of SMS users in your audience over the specified time period.
Delivered: The total number of SMS messages that your audience received. The difference between Sent and Delivered messages represents users who did not receive a message (i.e., problem with device connectivity or service, problem with the carrier, etc.).
Clicked: The total number of times that your audience clicked a message with Shorten LinksConverts HTTP/HTTPS URLs in your SMS messages to unique, shortened URLs for your recipients. The shortened URLs reduce the total number of characters that links consume and produce click tracking metrics, helping you determine how effective your SMS messages are in driving traffic to your links. enabled. You can use this metric as a general test of engagement. Use the links in your messages as calls to action; if a user clicks a link, your message was effective. This is a raw total. It is not limited to a single use per message or audience member.
For reporting on individual messages, go to Messages » Messages Overview and click for a message.
Surveys
Reports » Surveys provides aggregate information about responses to SurveysQuestion-and-answer experiences used to collect and aggregate feedback or generate a net promoter score. They are cached on users’ devices and displayed when your users meet certain conditions within your app, such as viewing a particular screen or opening the app a certain number of times. and also for questions and NPS surveys in ScenesMulti-screen experiences that are cached on users’ devices and displayed when your users meet certain conditions within your app, such as viewing a particular screen or opening the app a certain number of times. Scenes can include survey questions or be presented as a story..
Surveys and scenes are listed by name on two tabs: NPS and User Feedback.
- For scenes and surveys using the NPS template or User Feedback template, reporting is on their respective tabs.
- If a scene contains an NPS survey, its report will be on the NPS tab even if the scene also includes questions.
- If a scene A/B test includes questions or an NPS survey, its report is in NPS or User Feedback based on Variant A. After opening the report, responses are grouped in tabs by experiment and then by variant. To export variant-specific responses, click Download CSV in each variant’s tab.
In addition to the name are the scene/survey status, creation date, completed count, and dismissed count. The NPS tab also includes the overall NPS score. Click to view report data:
Total Displayed: The total number of surveys displayed on user devices.
Total Completed: The total number of surveys submitted.
Total Dismissed: The total number of surveys that were dismissed without being submitted.
Net Promoter Score: NPS survey reports display an overall NPS, as well as distribution by Detractors, Passives, Promoters.
Responses over time: Data is presented differently depending on question type. The default view is Last 7 days and you can select a different date range.
Single and Multiple Choice: The total number of responses and a chart showing the distribution of each response and the number of responses over time. Hover over the data to see the percentage value of answers.
Open Text: The total number of responses and a list of the actual user responses. In NPS survey reports these can be filtered by the NPS types: Detractors, Passives, Promoters.
NPS: A chart showing the number of responses and distribution of each response over time. Hover over a date to see the number of Detractors/Passives/Promoters and NPS for that date.
Unique App Opens
Reports » Unique App Opens counts the number of unique users who opened your app — it is not the number of times a single user opened the app. Change the date range to determine the frequency used to count app opens: hourly, daily, weekly, etc. The default view is Last 7 days.
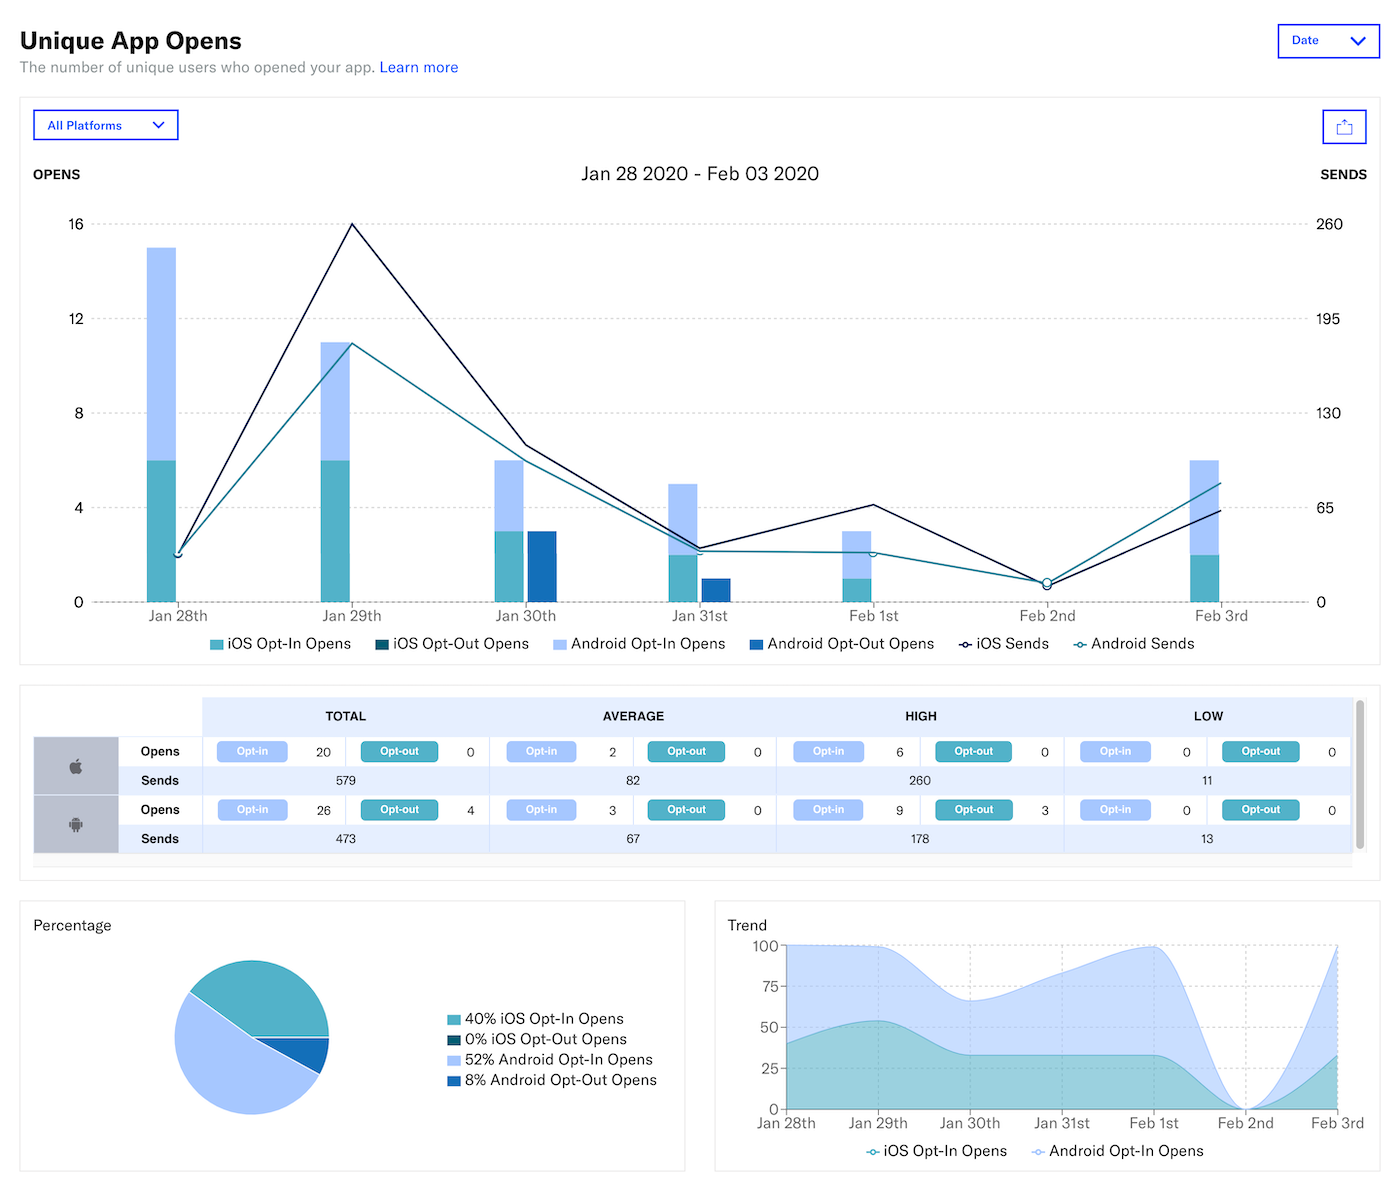
The top chart displays counts for Opt-in Opens and Opt-out Opens compared to Sends for all platforms, with total, average, high, and low values below. To filter by platform, click All Platforms and select iOS or Android. If your app only supports one platform, the filter is not displayed. When viewing a weekly or longer date range, you can click the column for a specific day to narrow the report to that day’s data.
Total is the sum of the displayed bars rather than the total number of unique users who opened the app in the defined time period. For example, if you are displaying seven days of data, a given user will appear only once per day but might be counted up to seven times in the total.
The Percentage pie chart compares the percentage of users who opened your app and were opted in to notifications (Opt-in Opens) to users who were opted out (Opt-out Opens). The Trend line graph displays the trending percentage of unique user app opens per platform.
The Percentage pie chart only counts users who opened your app in the displayed time range. This may not be an accurate representation of the percentages of your install base as a whole.
You might use the Unique App Opens report report to determine the opt-in and opt-out breakdown of your daily and monthly active users. By default, the report is set to the last 7 days, providing a view of daily active users.
When viewing daily active users (7 days’ activity), a user who opens the app three times on a single day and an additional four times on a different day would contribute one unique open for each of those days.
When viewing a monthly active users (30 days’ activity), a user who opened the app 10 times would contribute exactly one unique open for that month.
Web
Reports » Web provides aggregate web notification information for your entire Airship project and per campaign categoryAn optional delivery feature used to group messages of similar types or messaging strategies for aggregate reporting. Campaigns help you track the efficacy of both your individual messages and a messaging campaign as a whole.. Percentages are based on the total number of notifications sent. Select a preset date range or set a custom range to adjust the scope of the report.
Sent: The total number of Web notifications sent from your Airship project.
Clicked: The total number of notifications that users clicked.
Sessions: The total number of web sessions in the specified date range. This does not necessarily equate to total audience; audience members can initiate multiple sessions.
Attributed Sessions: Attributed web sessions are the total number of sessions attributed to a push notification. An attributed session is a session that occurs within a 12-hour window of a web push notification. Sessions are generated when a user directly visits the website with the Airship Web SDK present, or by clicking a web notification that leads the visitor to the site. The page the user visits must have the Web SDK installed to track sessions.
For reporting on individual messages, go to Messages » Messages Overview and click for a message.
Appendix: Push Influence Primer
A number of technical and user-behavior factors make it difficult to attribute an app open to a push notification with 100% accuracy. As the industry’s first and largest commercial push notification provider, Airship has both the experience and the data to recognize and model attribution across all app types with a high degree of confidence. The result is our Push Influence algorithm which informs the Push Response report.
As in the graph below, we see that App Opens rise dramatically after a push notification is sent.
App Opens vs. Pushes Sent

Direct Opens

As such, Direct Opens understate the true impact of a push notification. A significant number of additional opens will occur in the wake of a push, but in the absence of an interaction with the notification itself, attribution is complicated. Understanding that users are often occupied when the notification arrives and will return to the app later, we have a higher degree of confidence that a push influenced an open the sooner the open occurs relative to the push.
Indirect Open: when a user is sent a push, but DOES NOT tap it. Instead, it reminds them to open the app later, at a more convenient time.

To complicate matters, we must deal with the fact that some of the observed App Opens would likely have occurred anyway, even in the absence of a push notification. Every app has as natural amount of organic opens which will vary depending on app category, popularity, and other factors. We refer to this natural rate of App Opens as the Baseline Open Rate

With the context of Direct Opens, Indirect Opens, and Baseline Opens, we have a framework for understanding the true impact of push notifications on App Opens. We call this derived metric Influenced Opens.
Influenced Opens represent the number of opens that occur both directly and indirectly as a result of a push notification, less the baseline organic opens that would be expected anyway. The following four bullets describe the basic formula for arriving at the Influenced Opens figure:
- Influenced Opens include Direct Opens and Indirect Opens by opt-in users.
- Only opens within a 12-hour window* after the push is sent are included in the calculation.
- Baseline Opens are excluded from the Push Influence calculation.
- The Push Influence algorithm is more likely to attribute an open as “Influenced” the closer it occurs to the push.
The 12-hour window for App Open attribution has proven to be the most meaningful to Push Influence, when consistently applied across tens of thousands of apps in our database. Beyond 12 hours, we cannot maintain a high degree of confidence in the statistical significance of Indirect Opens vs. Baseline Opens.
Influenced Opens

Indirect Opens
Following a push notification, we typically observe a flurry of new opens above the Baseline Open Rate for a period of time. These “Influenced Opens” include both Direct Opens
The Push Influence algorithm attributes App Opens that occur within a 12-hour window of the push to this calculated metric, accounting for the Baseline Open Rate.
The further an indirect opt-in open occurs from the original send time, the less likely it is to be considered an Influenced Open.
Appendix: Push Response Terminology
- Opt-in Open
- Any app open observed by a user who has opted in to receive push notifications. The Airship SDK observes open events for all users and reports both total opens and opt-in opens.
- Direct Open
- An app open that occurs when a user interacts with a notification to open an app, e.g., taps a push notification in the notification center, lock screen, etc.
The percentage of opt-in opens is calculated as Total Direct Opens / Total Opt-in Opens * 100.
- Indirect Open
- An app open that is attributed to the presence of a push notification, but is not measured directly, i.e., the user does not tap the notification directly. Indirect opens are a derived metric which is explained more fully in Appendix: Push Influence Primer.
- Influenced Open
- The calculated number of App Opens attributed to a push notification, having occurred within a 12-hour window of the push being sent. This includes both Direct and Indirect Opens, and the algorithm subtracts expected hourly opens that are likely to have happened without the push, and also takes less credit for opens the further they occur from the push.
The percentage of influenced opens is calculated as Total Influenced Opens / Total Opt-in Opens * 100.
- Baseline Open
- App Opens that occur regularly, irrespective of push notifications being sent. Baseline Opens might also be considered a “natural” or “organic” open in that they are expected to occur even in the absence of push notifications. Baseline Opens are derived from historical open trends on an app-by-app basis, and are excluded from Push Influence attribution.
Categories
