Split Results By Tag
Performance Analytics enable you to analyze attributes of specific user groups. If you want to understand the attributes and behavior of your daily active users, one rich source of data to leverage is user tags — which tags are most common among daily active users?
This guide details the process of splicing Performance Analytics results by tag. You can apply this pattern to many views.
- Go to Reports » Performance Analytics.
- Select the Lifecycle dashboard.
- For the Daily Active Users report pane, click and select Explore From Here.
- Make these changes in the left side menu:
- In Tags Relative to Event » Dimensions, click Primary Device Tag to add it to the Results table.
- In Tags Relative to Event » Dimensions » Primary Device Tag, click Filter.
- In Visualization, select Pie.
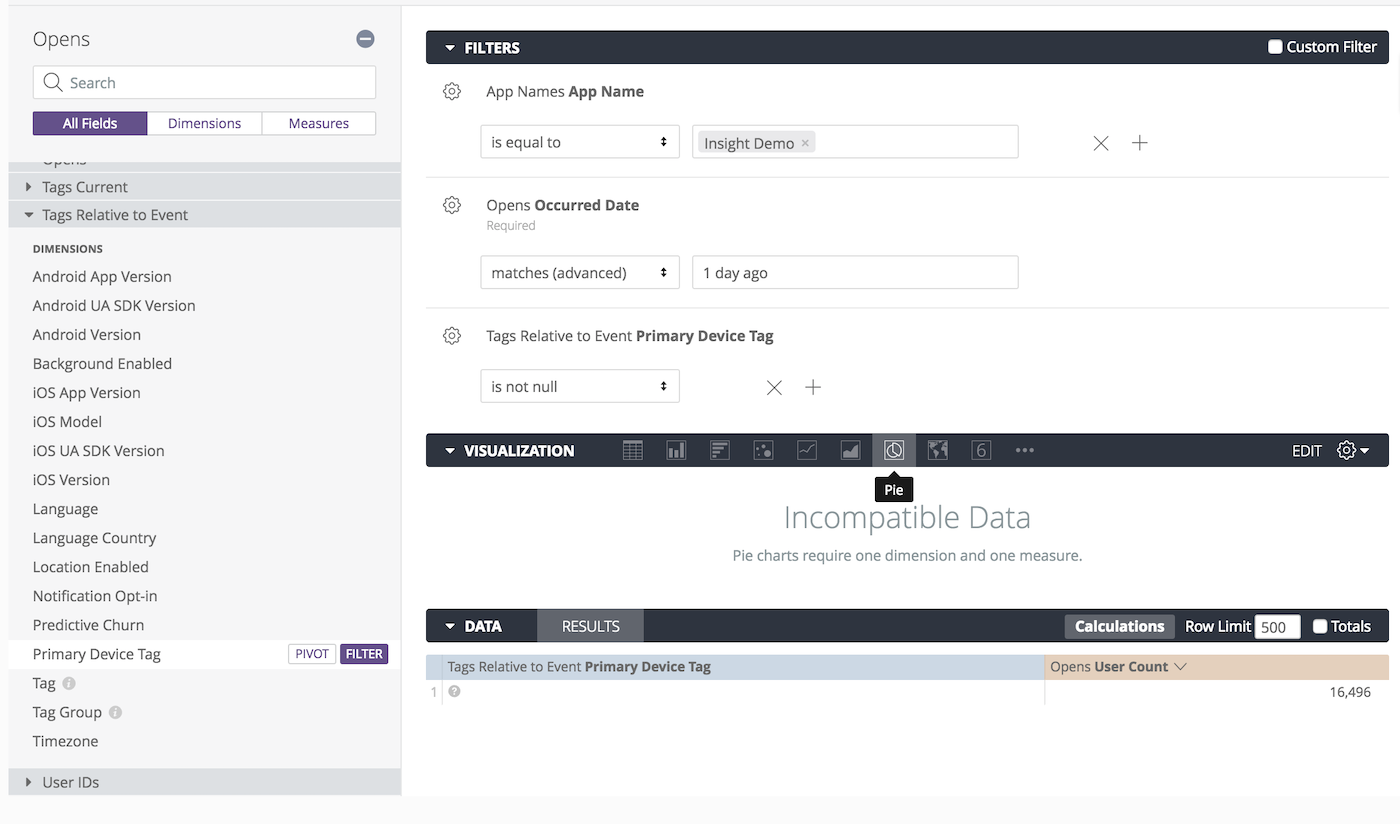
- In Filters, set the Primary Device Tag filter to
is not null. The view should now look something like this:
- Click Run.

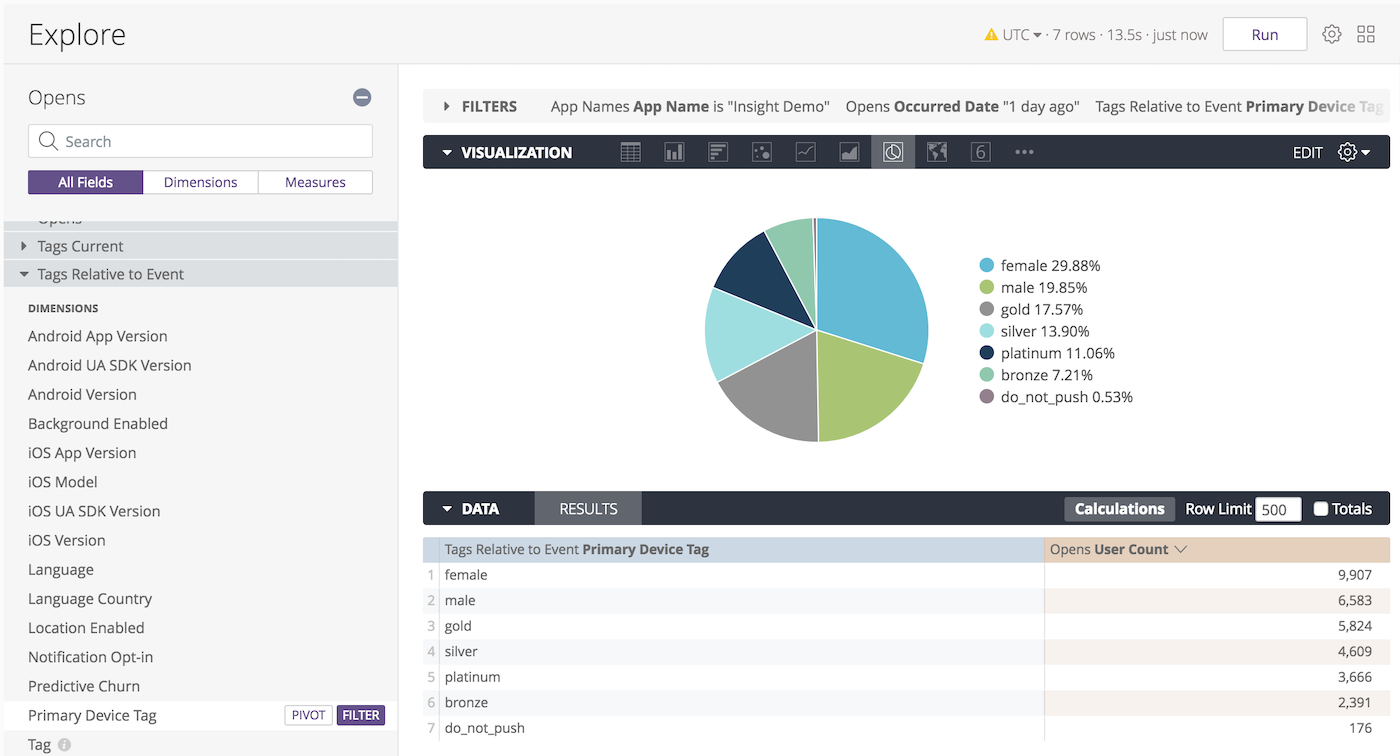
You now have a list of tags associated with the users that opened the app yesterday!
Tag Split Analysis
Because a single user can have multiple tags set, the sum of values on the right side of the table does not correspond to the total number of daily active users, e.g., in the final image, a single user could have the likely-buyer, basketball and bourbon tags. In this case, one user accounts for three tags in the table. The total at the bottom right corresponds to the number of users that opened the app and had a tag set. If a user with no tags set opens your app, their action will not be included in the total. Consequently, the total may not match the number of daily active users.
Additional Splicing Options
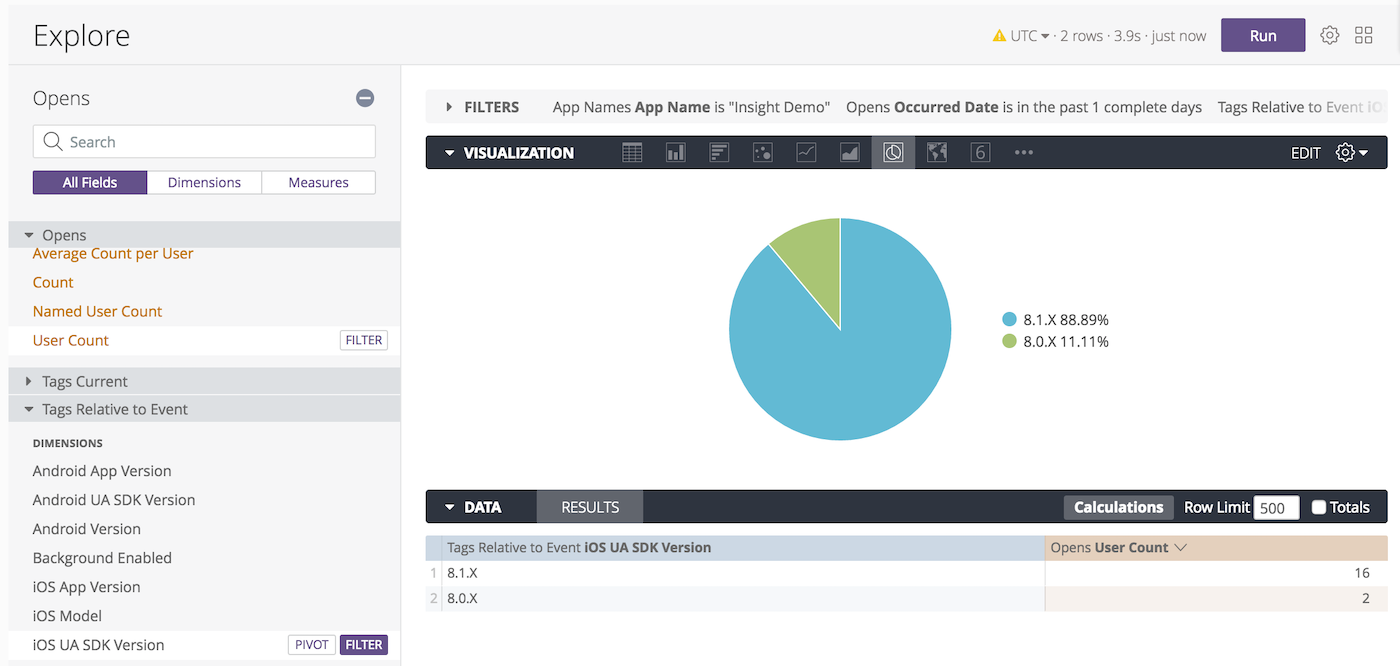
You can also filter by specific device property tags. For example, we can look at the iOS SDK versions used by our daily active users. In Step 3 above, rather than selecting Primary Device Tag, select iOS UA SDK Version.
We’ve predefined many of the important tag groups for you, but we also provide general Tag Group and Tag dimensions if you’re interested in other tags. Setting Tag Group as a filter will generate a drop down list of possible values. The Tag dimension contains the specific values within each possible Tag Group. It is not necessary to filter out the null values when using the combination of Tag Group and Tag dimensions.
You can see Tags at different time periods using Tag Current or Tag Relative
to Event. Tag Current is the current value, where Tag Relative to Event is a
user’s tag at a certain event, such as an open or region event. Tags Current
and Tags Relative to Event function in the same manner.
We can see that most of our daily active users that use iOS are on SDK 8.1.x.
Categories
