Report on Funnel and Path
This tutorial expands on templated funnels to show how you can create your own funnel and path reports. These reports are powerful tools for analyzing the behaviors of your users. Funnel and path are available for Custom EventsEvents that indicate that a user performed a predefined action, such as adding an item to a shopping cart, viewing a screen, or clicking an Unsubscribe button. Custom events can trigger automation, including Sequences, Scenes, and Surveys. You can code them into your app or website, or send them to Airship from an external source using the custom event API. Custom events contain properties that you can use to personalize messages..
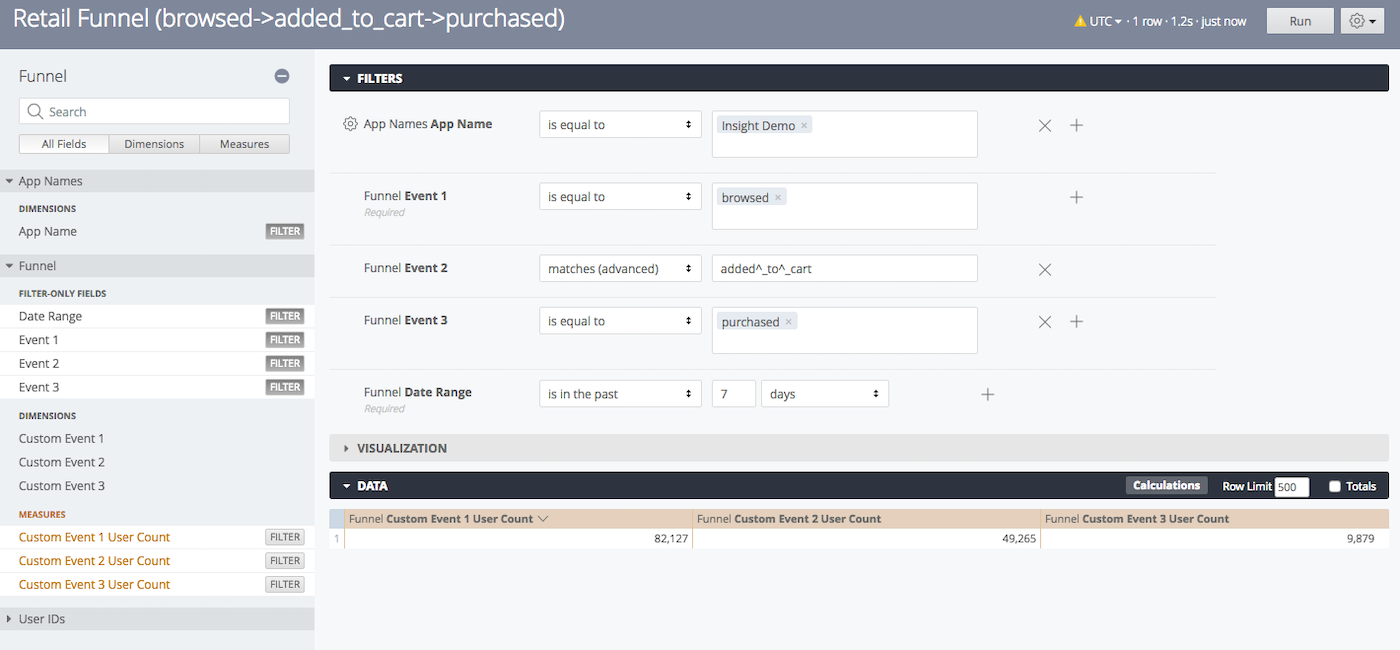
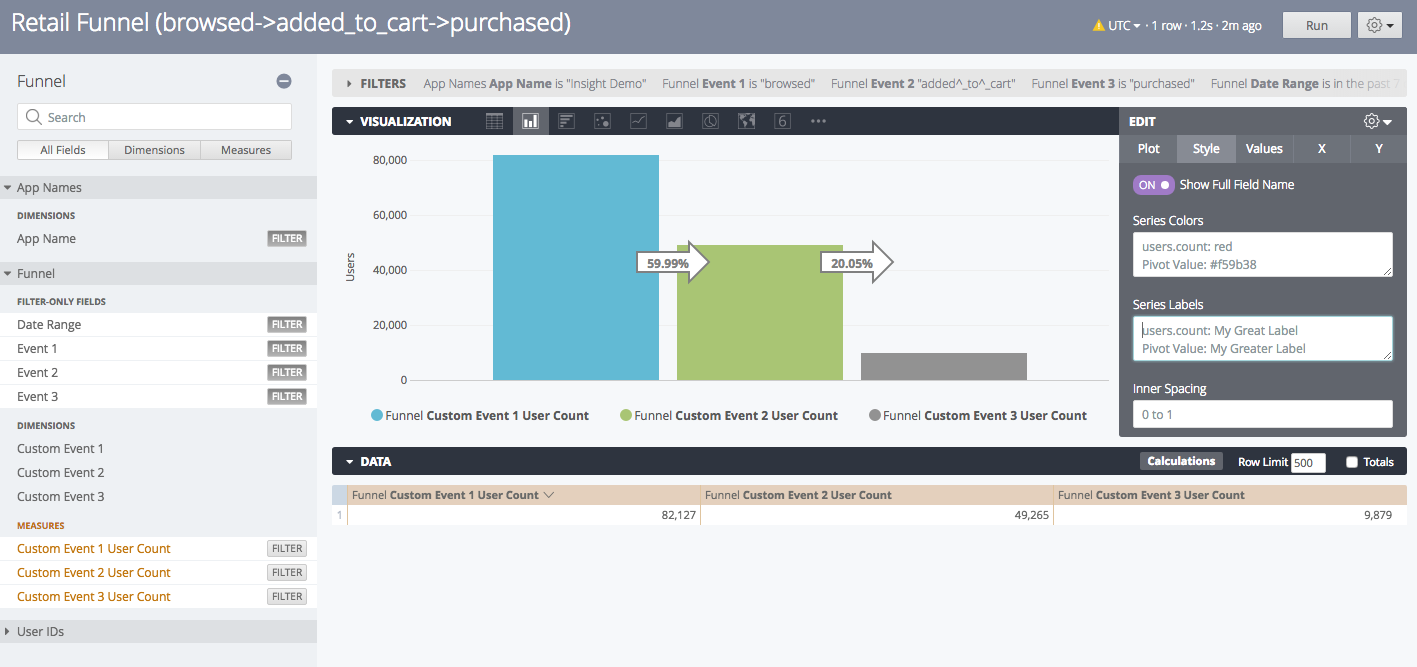
Since most users are unable to complete a goal in a single session, our example funnel and path report shows goals achieved over a time range.
Show Goals Achieved Over a Time Range
- Go to Reports » Performance Analytics.
- Select the Revenue dashboard.
- For the Funnel report, click and select Explore From Here.
- In Filters, edit the filters and values as desired, then click Run.

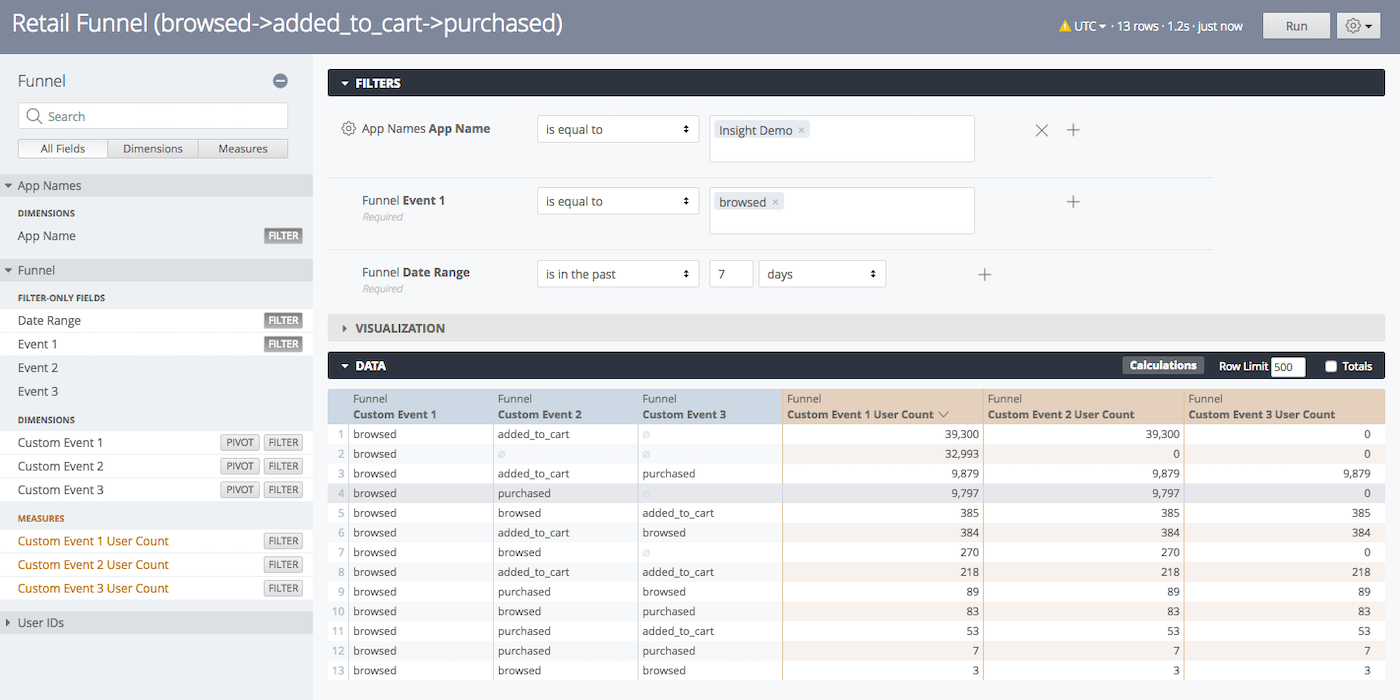
See the Path of Users
To see the path of users, e.g., abandoned cart, follow these steps after completing the steps in Show Goals Achieved Over a Time Range:
Categories


