Getting Started with Performance Analytics
Performance Analytics visualizes engagement data, helping you understand what your customers are doing and which behaviors cause them to take action.
With user-level audience engagement dashboards, ad-hoc discovery tools, and conversion reporting, you can uncover the “why” behind your ROI.
Enabling Performance Analytics
All current Airship plans include Performance Analytics. If you find you do not have access, Contact Airship Sales to enable it for your account. See also Data in the Feature packages reference.
Navigating
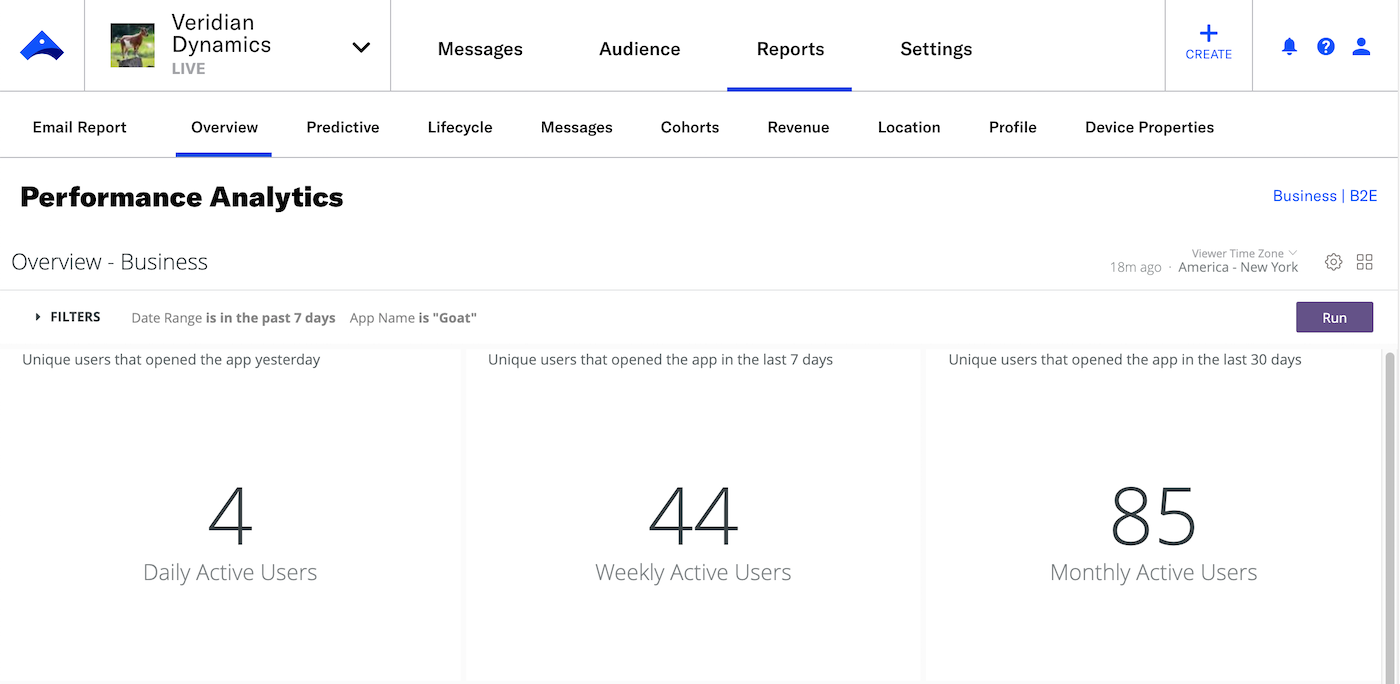
Go to Reports, then Performance Analytics. Immediately below the project header are tabs for the default Dashboards: Overview, Lifecycle, etc. Each default Dashboard is a collection of topical reports, called Looks, displayed in tiles.

Below the tabs is the project’s industry and sub-industry. If they are incorrect, select them to open your project’s settings, select a new industry and sub-industry, and then select Update project. Ths requires Owner, Administrator, or Full Access permissions.
Dashboard layout and options
All Dashboards have the same basic layout and options. Below the Dashboard name are its default filters with preset values. Opposite these are:
- The time since the data last updated
- Icon buttons to reload the data, show/hide filters, access additional Dashboards and Looks, and perform these actions:
- Download as a CSV or PDF
- Schedule delivery of the data — You can select various methods, formats, and other options.
- Reset the filters if you edited them
Where available, select the “i” icon () next to a Look’s name to read its definition.
Shared Dashboards and Looks
To access additional Airship-curated Dashboards and Looks, select the folder icon (), then Shared. You will see individual Dashboards and Looks, and more are organized within folders.
For more information, see Default Dashboard and Look definitions.
Categories
